Revealed: the towns where the priciest homes are the ones losing money
Published 15 August 2026 · 9 min read · By Evren Ergin
In 102 of the 107 English and Welsh districts ValuQ could measure reliably, houses in the most expensive quarter of their local market resold at a loss more often than houses in the cheapest quarter. These are not mansions: the typical top-quarter house in the analysis cost £425,000.
TL;DR
- •Across 231,507 houses bought since 2019 and resold in the two years to April 2026, 9.6% of top-quarter homes sold for less than the owner paid, against 4.0% at the bottom of the same local markets.
- •The gap is wider outside London than inside it, which means this is not the prime central London story that made headlines on 10 August 2026.
- •Of 107 districts with enough repeat sales to measure, 102 showed the same pattern and 71 showed the top-end loss rate at least doubling the bottom-end rate.
- •Among houses bought in 2022, more than one in four top-quarter homes resold below the price paid.
- •The pattern holds inside every house type and after excluding every home bought new, so it is not a detached-house or new-build effect.
Advertisement

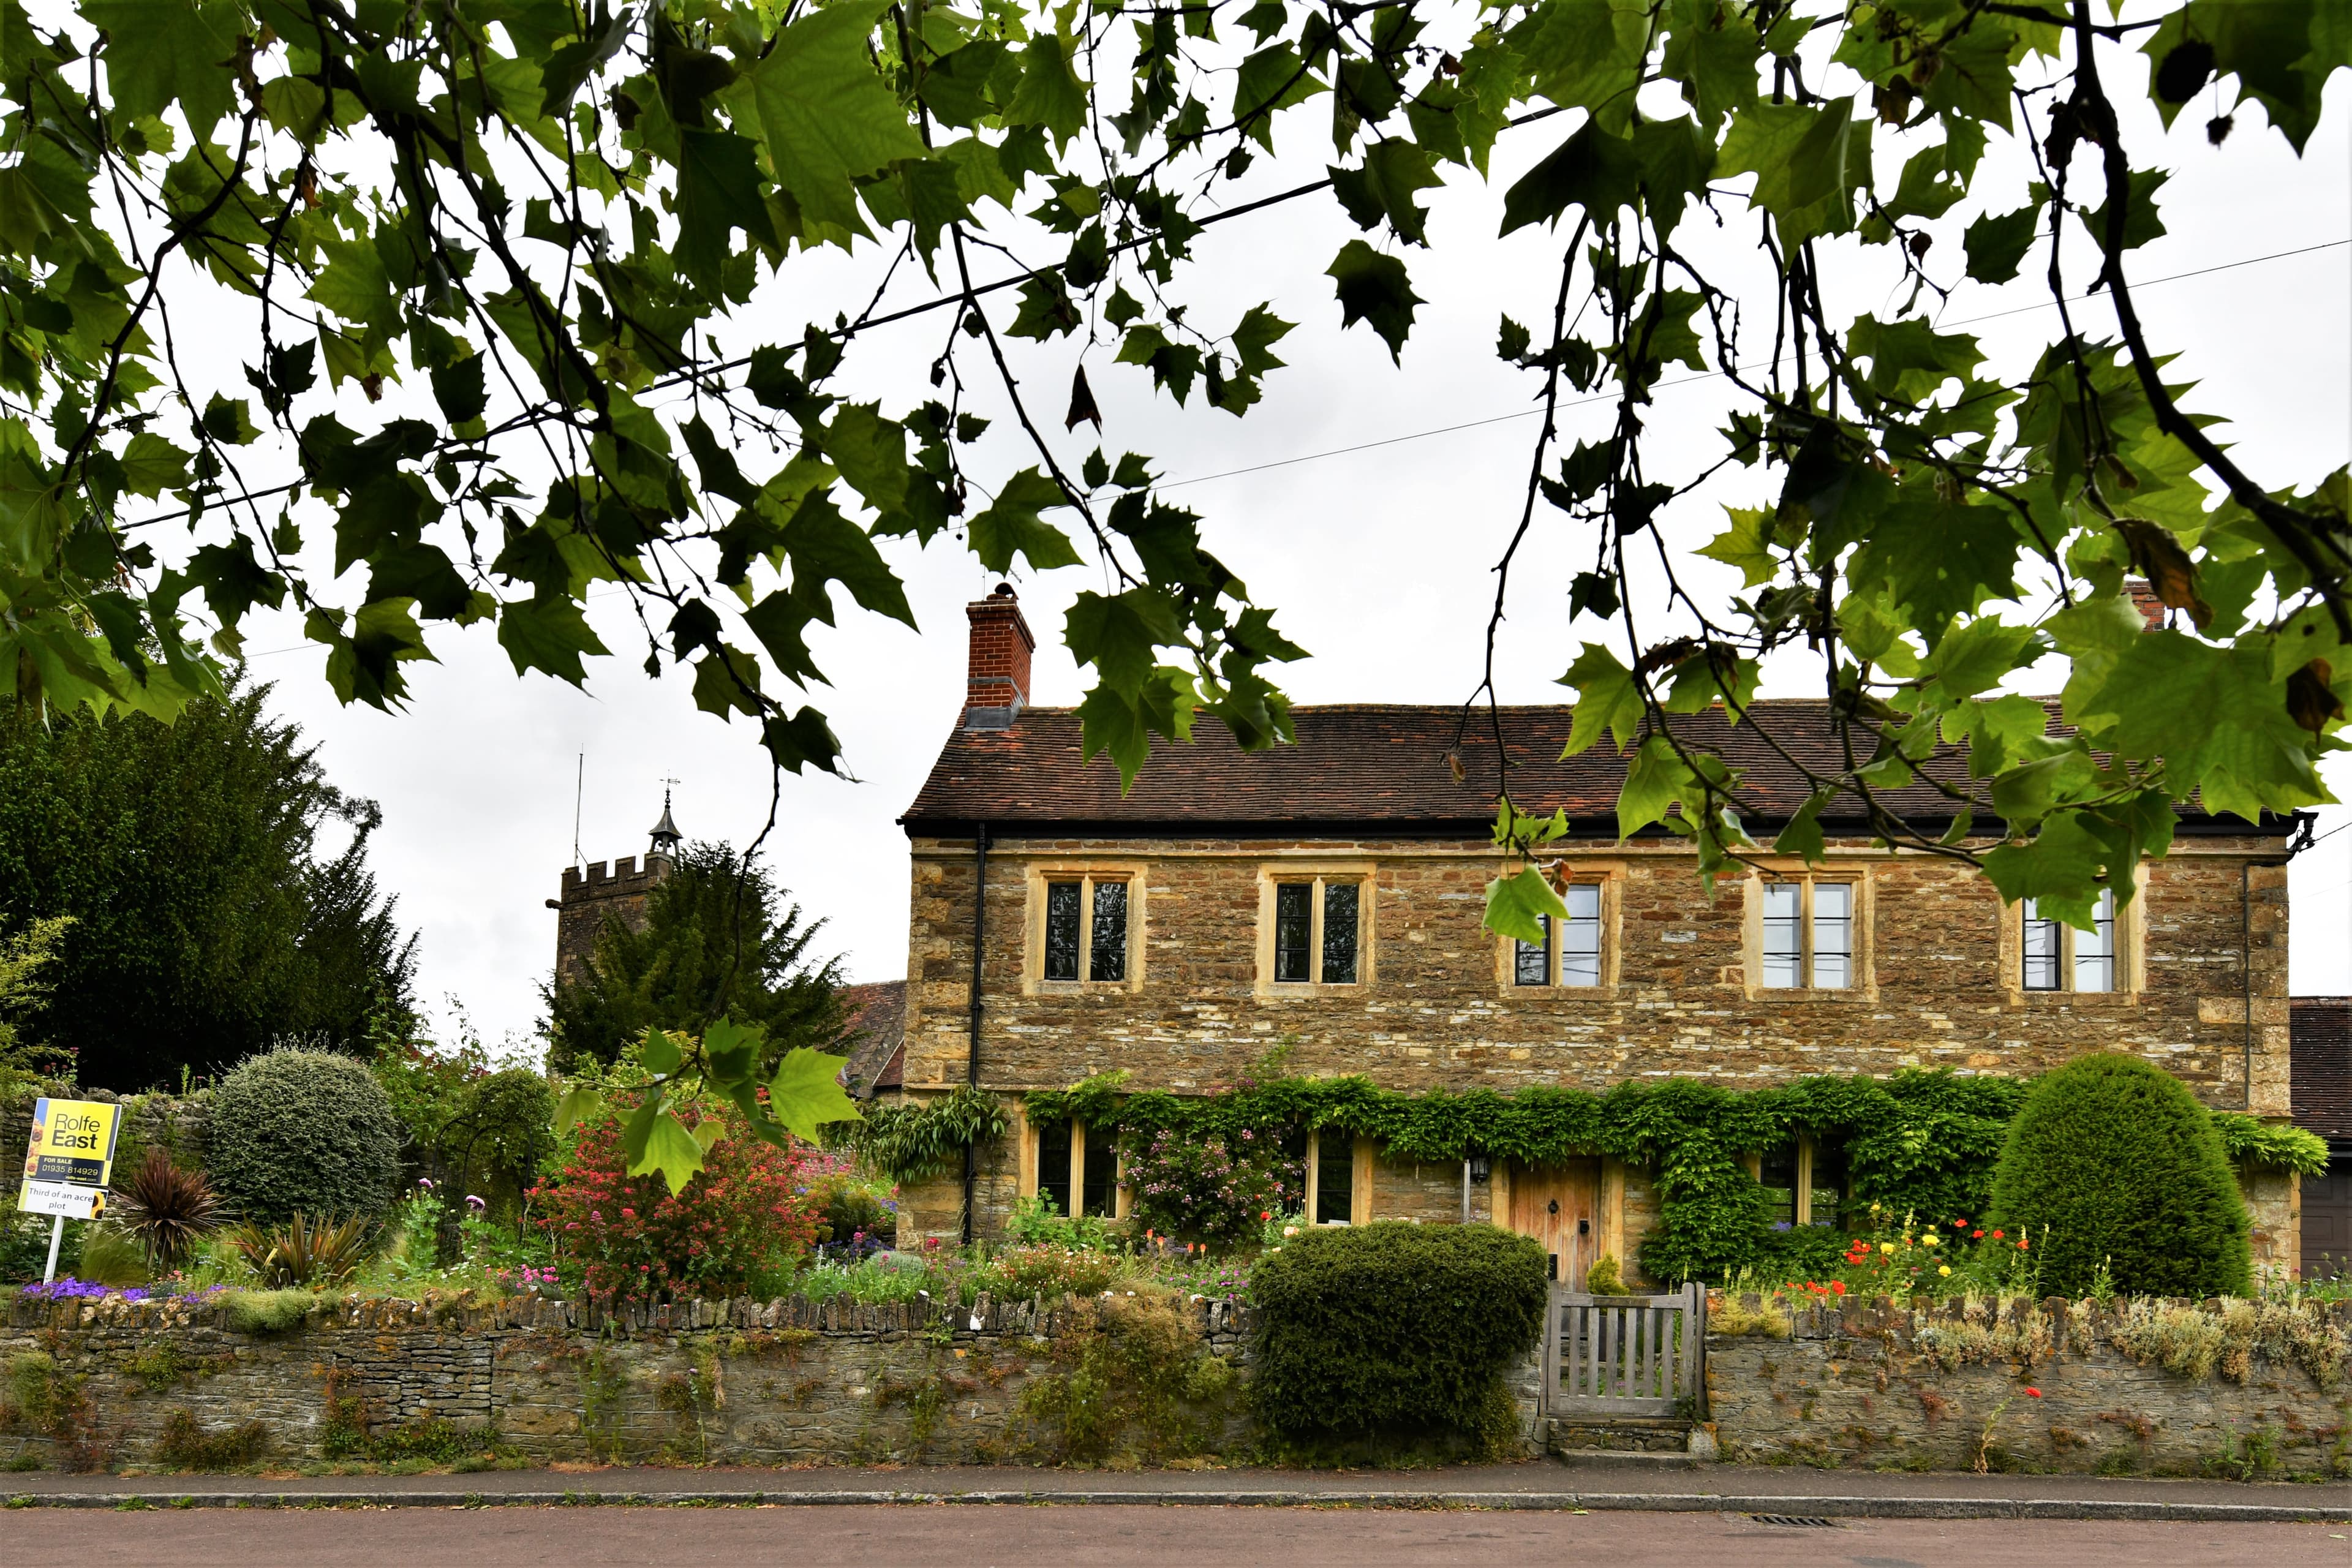
Research by ValuQ: we tracked 231,507 houses in England and Wales that were bought in 2019 or later and sold again in the two years to 30 April 2026, then sorted each one by where it sat in its own district's price range on the day it was bought. Flats were excluded, so every comparison here is house against house.
This is the weekly ValuQ Property Watch. On 10 August 2026, analysis by Connells Group reported that almost 46% of homes bought for £2m or more are now worth less than their owners paid, rising to 56% in London, with an average shortfall of £524,885. The coverage that followed read it as a story about the very top of the market. Our own data says the same pattern is running in ordinary towns, at ordinary prices, and in places that have no prime market at all.
What did ValuQ find?
Houses in the most expensive quarter of their local market resold below the price paid 9.6% of the time. Houses in the cheapest quarter of those same markets did so 4.0% of the time. The top quarter also earned less for every year it was owned, at 3.33% a year against 5.28%.
A nominal loss is a sale for fewer pounds than the owner paid. It is measured before stamp duty, legal fees, agent fees or any money spent on the property, so the true shortfall for those sellers is larger than the figures below.
ValuQ analysis: 231,507 houses in England and Wales bought in 2019 or later and resold in the two years to 30 April 2026
| Where the house sat in its local market | Houses tracked | Median price paid | Median resale price | Median gain a year | Sold below the price paid |
|---|---|---|---|---|---|
| Cheapest quarter | 48,311 | £150,000 | £190,000 | 5.28% | 4.0% |
| Middle half | 134,006 | £242,100 | £288,000 | 3.92% | 6.0% |
| Most expensive quarter | 49,190 | £425,000 | £490,000 | 3.33% | 9.6% |
Is this just the prime London story in disguise?
No, and the London numbers are the clearest evidence of that. Inside Greater London, 6.7% of top-quarter houses resold below the price paid, against 2.2% at the bottom. Both figures are lower than the national picture, and the widest gaps we found were in districts a long way from the capital.
The price levels matter too. The typical top-quarter house in this analysis cost £425,000. In Plymouth it cost £309,665. A home does not need to be expensive in national terms to be expensive for the street it stands on, and it is that local position, not the headline price, that tracks the risk.
Which districts show the widest gap?
Of the 107 districts with enough repeat sales to measure reliably, 102 showed top-quarter houses losing money more often than bottom-quarter houses. In 71 of them the top-quarter loss rate was at least double the bottom-quarter rate. The twelve widest gaps are below.
ValuQ analysis: the twelve districts with the widest gap between top-quarter and bottom-quarter loss rates (minimum 150 top-quarter and 100 bottom-quarter resales)
| District | Top quarter sold at a loss | Cheapest quarter sold at a loss | Gap in percentage points | Median paid, top quarter |
|---|---|---|---|---|
| Huntingdonshire | 20.3% | 5.9% | 14.4 | £470,995 |
| Chelmsford | 16.3% | 2.7% | 13.7 | £616,000 |
| Wealden | 20.1% | 6.5% | 13.6 | £633,750 |
| West Northamptonshire | 17.7% | 4.0% | 13.6 | £474,875 |
| Plymouth | 14.1% | 0.9% | 13.2 | £309,665 |
| Canterbury | 18.3% | 5.2% | 13.1 | £546,500 |
| North Northamptonshire | 21.6% | 9.1% | 12.6 | £385,748 |
| Eastleigh | 14.5% | 2.0% | 12.5 | £500,000 |
| Somerset West and Taunton | 17.1% | 4.6% | 12.5 | £430,750 |
| Cornwall | 18.4% | 6.0% | 12.4 | £465,000 |
| West Suffolk | 16.1% | 4.2% | 11.9 | £450,000 |
| Breckland | 18.0% | 6.6% | 11.5 | £425,000 |
Could this just be because expensive homes are detached?
It could not. The pattern survives inside each type of house, which rules out a change in what sort of property was selling.
- Detached houses in the upper half of their local market resold at a loss 8.9% of the time, against 4.8% for detached houses in the lower half.
- Semi-detached houses: 7.4% in the upper half against 4.1% in the lower half.
- Terraced houses: 7.4% in the upper half against 5.1% in the lower half.
- Excluding every home that was bought new, the top quarter still resold at a loss 9.6% of the time against 4.0% at the bottom, so this is not the new-build premium at work.
Did top-end buyers simply buy at a worse moment?
They did not. Splitting the same houses by the year they were bought shows the top quarter doing worst in every single cohort, including the years when almost nobody lost money.
ValuQ analysis: share of houses that resold below the price paid, by the year they were bought
| Year bought | Cheapest quarter | Middle half | Most expensive quarter |
|---|---|---|---|
| 2019 | 1.6% | 1.2% | 2.3% |
| 2020 | 1.5% | 1.6% | 3.1% |
| 2021 | 2.9% | 4.5% | 8.7% |
| 2022 | 10.5% | 18.5% | 27.0% |
| 2023 | 9.0% | 16.8% | 25.7% |
The 2022 row is the one to sit with. Among houses bought that year and resold by April 2026, more than one in four in the top quarter of their local market went back to the market for less than the owner paid.
Why would the top of a local market be the weakest part of it?
The buyer pool thins as the price rises. A £200,000 terrace in a town competes for first-time buyers, second steppers, downsizers and landlords. The most expensive quarter of the same town is sold to a much smaller group, most of whom need to sell something else first, and higher borrowing costs cut that group faster than they cut the bottom of the market.
The wider market has not been rescuing anybody either. The RICS UK Residential Market Survey published on 13 August 2026 put new buyer enquiries at a net balance of -28% and agreed sales at -30%, both unchanged on the month. Nationwide reported on 31 July 2026 that annual house price growth had slowed to 1.8%, with the average home at £277,542. In a market moving that slowly, a thin buyer pool shows up as a price cut rather than a longer wait.
What does this mean if you own the biggest house on your street?
- Your risk is not set by the national average. It is set by where your home sits in the price range of the town it stands in, and the top quarter of that range is where the losses concentrate.
- Treat any valuation built on what the biggest house nearby sold for in 2021 or 2022 with care. Those are the two cohorts carrying the highest loss rates in this data.
- Ask for more than one valuation. The wider the price, the wider the honest disagreement between agents about what it is worth, and the more a single opinion can cost you.
- If you are downsizing, the gap you are relying on may have narrowed. The cheapest quarter of the same markets grew at 5.28% a year while the top quarter grew at 3.33%.
- Time is the one thing that has consistently worked. Houses bought in 2019 and 2020 resold at a loss between 1.5% and 3.1% of the time, whichever band they sat in.
What does it mean for buyers?
The top of a local market is where the negotiating room is. A buyer looking at the most expensive quarter of a town is competing with fewer people than at any other price point, and the seller's alternative is a long wait. That is a real advantage, and it is worth knowing which side of the local line a house sits on before making an offer.
The instinct is that the bigger house is the safer asset. For anyone who bought since 2019, our data says the opposite has been true. That is not a reason to panic. It is a reason to price a home on evidence rather than on what the largest house on the street fetched three years ago.
Evren Ergin, founder of ValuQ.
How did ValuQ work this out?
ValuQ analysed HM Land Registry Price Paid Data for England and Wales, downloaded on 15 August 2026. We matched houses that sold twice at the same address and property type, kept only arm's-length full-market-value sales, and excluded flats. We then kept the 231,507 pairs where the first sale was in 2019 or later, the second sale fell between 1 May 2024 and 30 April 2026, and at least two years separated the two.
Each home was placed in its local market by ranking its first sale price against every other sale in the same district in the same year. The bottom quarter, middle half and top quarter of that ranking are the three bands used throughout. District tables are restricted to districts with at least 150 top-quarter and 100 bottom-quarter resales, which leaves 107 of them. Land Registry data for the most recent months is still being registered, which is why the window closes at April 2026.
ValuQ gives UK homeowners free, side-by-side property valuations from competing local estate agents. Sellers stay anonymous until they choose to connect, which is how a homeowner at the top of their local market can gather several honest opinions on price without their phone starting to ring.
Sources
- [1]HM Land Registry Price Paid Data (England and Wales), analysed by ValuQ · 2026-08-15 · https://www.gov.uk/government/statistical-data-sets/price-paid-data-downloads
- [2]Connells Group analysis of £2m-plus homes, reported by Yahoo Finance · 2026-08-10 · https://finance.yahoo.com/real-estate/articles/wealthy-homeowners-face-500k-house-113030654.html
- [3]RICS UK Residential Market Survey, July 2026 · 2026-08-13 · https://www.rics.org/news-insights/market-surveys/uk-residential-market-survey
- [4]Nationwide House Price Index, July 2026 · 2026-07-31 · https://www.nationwide.co.uk/media/hpi/
Terms in this article
Plain-English definitions from the ValuQ property glossary.
HM Land Registry
HM Land Registry is the government body recording ownership of land in England and Wales, whose register is the definitive proof of title.
Stamp duty land tax (SDLT)
Stamp duty land tax is the tax buyers pay on property purchases in England and Northern Ireland, charged in slices at rising rates.
RICS
RICS is the Royal Institution of Chartered Surveyors, the professional body that sets the standards UK surveyors and valuers work to.
Read next
Related insights
The new 2.5% deposit scheme: what it means if you're selling
What happens if my estate agent goes out of business?
Can I switch estate agent while my house is on the market?
Can my estate agent use AI to edit photos of my house?
What is your home worth today?
ValuQ gives UK homeowners free, side-by-side property valuations from competing local estate agents. Anonymous until you choose. No cold calls.
Get your free anonymous valuationSellers and buyers never pay.