In Essex, your street decides more than your town does
Published 12 August 2026 · 8 min read · By Evren Ergin
Two like-for-like Essex homes in the same town, bought and sold in the same years, end up about 10.5 percentage points of price growth apart purely because of their street. The gap between the county's strongest and weakest towns is 8.1 points.
TL;DR
- •ValuQ followed 358,537 individual Essex homes from one sale to the next, 1995 to 2026, across all 14 districts.
- •Two like-for-like homes in the same town finish about 10.5 percentage points apart on price growth because of their street. The gap between Essex's strongest and weakest towns is 8.1 points.
- •About 71 per cent of the geographic variation in Essex price growth sits between streets inside a town, not between towns.
- •It is not noise: splitting each street's sales into two random halves gives a correlation of 0.568 across 3,463 streets.
- •Just over half of a street's outperformance before 2015 carried into the decade after it. For flats, the block matters more than twice as much as the town.
Advertisement

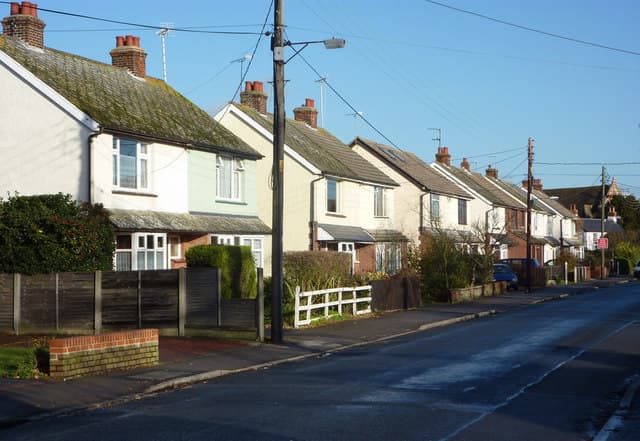
Research by ValuQ: we followed 358,537 individual Essex homes from one sale to the next, across every one of the county's 14 districts, to measure how much of a home's price growth is decided by its town and how much by its street.
Take two Essex homes of the same type, in the same town, bought in the same year and sold in the same year. On average they finish about 10.5 percentage points of price growth apart purely because of the street they sit on. The gap between the strongest and weakest of the county's 14 towns, measured exactly the same way, is 8.1 points. On the median £343,000 Essex sale since 2020, 10.5 points is worth roughly £34,000.
Almost every house price number a homeowner reads is a town number. So is almost every instant online estimate. This is a measure of how much that unit hides.
The towns are closer together than the headlines suggest
Each home was compared against the median price change of every other Essex home of the same type, bought in the same year and sold in the same year. Because the purchase year and the sale year are both fixed, the length of ownership and the market cycle are controlled by construction. What is left is the home and where it sits.
ValuQ analysis of HM Land Registry Price Paid Data, 1995 to 2026. Nine of the 14 Essex districts shown. This ranks growth against the county market, not price levels.
| Town (district) | Homes followed | Against the county market | Best-to-worst gap between 14 of its streets |
|---|---|---|---|
| Southend-on-Sea | 40,317 | +4.01 points | 12.7 points |
| Thurrock | 30,011 | +2.76 points | 11.2 points |
| Basildon | 34,526 | +1.07 points | 9.8 points |
| Brentwood | 15,917 | +0.04 points | 11.8 points |
| Chelmsford | 35,480 | -0.50 points | 10.8 points |
| Harlow | 15,226 | -1.17 points | 7.9 points |
| Colchester | 36,311 | -2.12 points | 11.6 points |
| Tendring | 33,192 | -2.24 points | 12.6 points |
| Uttlesford | 15,007 | -4.07 points | 9.0 points |
Southend-on-Sea to Uttlesford is 8.08 points, top to bottom, over three decades. That is the entire spread of the Essex towns.
Inside one town, the streets are further apart than that
Comparing the best and worst of two hundred streets against the best and worst of 14 towns would flatter streets automatically, because extremes widen as you add candidates. So we drew exactly 14 streets at random inside a single town, took the gap between the best and the worst, and repeated it two hundred times.
The answer is 10.5 points, against 8.1 points for the towns. In 12 of the 14 districts the average 14-street gap is wider than the entire between-town range. Raising the bar to streets with at least 80 sale pairs widens it to 11.3 points, so the headline figure is the cautious one.
Put another way, about 71 per cent of the geographic variation in Essex price growth sits between streets inside a town rather than between towns.
This is not a small-sample illusion
A street with forty sales could look several points off the market by chance alone, so we split each street's sales into two random halves and asked whether the halves agree. Across the 3,463 streets with enough sales to test, they correlate at 0.568. Half of a street's sales predict the other half.
Two obvious objections were tested and neither holds. Cheaper streets grew faster in percentage terms, but removing the effect of where a home sits in the local price distribution makes the street gap slightly wider, not narrower. And the weakest streets are heavily flats, but running houses only still gives a street spread level with the whole between-town range.
For a flat, the block matters more than twice as much as the town does. That is the widest version of this finding anywhere in the data.
And it lasts
A street gap that reshuffles every few years would be trivia. Splitting each street's record into sales completing up to 2014 and sales completing from 2015, just over half of a street's outperformance in the first period carried into the decade that followed. The part that repeats is still wider than the entire spread between Essex towns.
Billericay, two streets, same postcode district
Basildon borough sits close to the middle of the county at +1.07 points and carries 34,526 sale pairs. The clearest like-for-like example inside it is in Billericay, comparing houses only, both streets in the CM12 outcode.
ValuQ analysis of HM Land Registry Price Paid Data. Houses only, both compared against homes of the same type bought and sold in the same years.
| Street | Outcode | Homes followed | Against the county market |
|---|---|---|---|
| Western Road | CM12 | 59 | +4.6 points |
| Whitesmith Drive | CM12 | 116 | -5.3 points |
Same town, same postcode district, same property type, same buying and selling years. A 9.9-point gap, worth about £32,000 on a £343,000 sale.
The home itself still matters most
The honest hierarchy, measured as the spread of market-adjusted growth: the individual home 15.2 points, the street within its town 3.6 points, the town within Essex 2.3 points. Condition, plot, aspect and what the owners spent still dominate everything else.
The point is not that the street outweighs the house. It is that the street outweighs the town, and the town is the unit nearly every price report and online estimate is built on.
What this means if you are selling in Essex
1. Treat a town-level number as a starting point, not an answer
About 71 per cent of the geographic difference in what Essex homes gained sits below town level. If your street has been running ahead of your town, a town-average valuation quietly costs you. If it has been running behind, it sets an asking price the market will not meet, and the home sits.
2. Ask for the sold prices on your street, not your postcode
The test of whether someone valuing your home knows your market is whether they can talk about your road and the roads either side of it, and show you the sales behind their number. That evidence is free and public.
3. Expect a range
Two homes on the same street, same type, bought and sold in the same years, routinely finish well apart. A single confident figure with nothing behind it is claiming a precision the data does not support.
4. Get more than one local opinion
An agent who has sold on your road for years holds information no county-level dataset contains. Comparing what several of them say about the same home is the fastest way to see where the real number sits.
Everyone in this industry repeats that location is everything, and then values homes off a town average. Our own data says the town is the smaller half of the story. Inside one Essex town, the street moves a home's long-run growth more than the choice of town does.
Evren Ergin, founder of ValuQ
How we did this
ValuQ analysed the complete HM Land Registry Price Paid file, downloaded on 16 July 2026 and covering completions from 1 January 1995 to 28 May 2026. Filtered to ceremonial Essex, which is three separate county entries in the data, and to standard residential sales, that is 1,029,458 sales at 523,044 addresses across 14 districts. Each sale was matched to the previous sale at the same address, keeping pairs where both legs are the same property type, both are existing stock rather than a new build, the two sales are at least two years apart, and each price sits between 50 and 250 per cent of the local median for that district, type and year. That gives 358,537 pairs on 19,029 named streets, with a median ownership of 6.5 years. Every pair was compared against the median price change of all Essex pairs sharing its property type, purchase year and sale year. Street estimates are shrunk towards zero in proportion to how few sales they rest on, which makes every street figure here conservative.
Where this could be wrong
This is an association measured across hundreds of thousands of homes, not an experiment. Homes are not randomly assigned to streets, and property mix, plot sizes, tenure, through traffic, flood risk and how much owners spent are all bundled into the street figure. Growth here is gross of anything an owner spent on the home. Price Paid data covers England and Wales only and leaves out transfers that are not standard sales. Street rankings measure price growth against the county market and are not a judgement of any street as a place to live.
Does the street really affect house prices more than the town?
For price growth over the long run in Essex, yes. Two like-for-like homes in the same town, bought and sold in the same years, sit about 10.5 percentage points apart on their street alone, against 8.1 points between the county's strongest and weakest towns.
How can I find out how my street has performed?
HM Land Registry Price Paid data is free and public, and every major property website shows sold prices for a street going back to 1995. Look at repeat sales of the same address rather than averages, because averages move with whichever homes happened to sell.
Does this mean online valuations are wrong?
It means a number built on a town or postcode district average is working at the wrong resolution for an individual home. The single largest source of difference is still the home itself, at 15.2 points.
Which Essex town performed best against the county market?
Southend-on-Sea at +4.01 points, then Thurrock at +2.76. Uttlesford sits at the other end at -4.07. This is growth against the county market since 1995, not price levels.
Does ValuQ charge homeowners?
No. ValuQ is free for homeowners, always. Sellers and buyers never pay, there are no fees and no data sales.
This is part of ValuQ Property Watch, our running series of original research on the UK housing market. ValuQ gives UK homeowners free, side-by-side property valuations from competing local estate agents, with the seller staying anonymous until they choose otherwise.
Sources
- [1]HM Land Registry Price Paid Data (complete file) · 2026-07-16 · https://www.gov.uk/government/statistical-data-sets/price-paid-data-downloads
- [2]Zoopla House Price Index · 2026-07-30 · https://www.zoopla.co.uk/discover/property-news/house-price-index/
- [3]Giacoletti, M. Idiosyncratic Risk in Housing Markets, Review of Financial Studies 34(8) · 2021-08-01 · https://doi.org/10.1093/rfs/hhab033
Terms in this article
Plain-English definitions from the ValuQ property glossary.
HM Land Registry
HM Land Registry is the government body recording ownership of land in England and Wales, whose register is the definitive proof of title.
Flood risk
Flood risk is a property's exposure to river, surface water or groundwater flooding, checked through searches and government flood maps.
Read next
Related insights
Basildon's 2021 buyers are up £52,800 as their five-year fixes end
Can I switch estate agent while my house is on the market?
Can my estate agent use AI to edit photos of my house?
A buyer wants to film my house at the viewing. Should I let them?
What is your home worth today?
ValuQ gives UK homeowners free, side-by-side property valuations from competing local estate agents. Anonymous until you choose. No cold calls.
Get your free anonymous valuationSellers and buyers never pay.