The homes that keep coming back sell for thousands less
Published 10 August 2026 · 8 min read · By Evren Ergin
A home in England and Wales that has changed hands five times or more since 1995 has grown about 3.8 percentage points less than a like-for-like home in the same district, of the same type, bought and sold in the same years, that changed hands only twice. On a typical purchase price that is roughly £7,200 of gain that never arrived.
TL;DR
- •ValuQ analysed 29,525,866 completed sales from HM Land Registry Price Paid records and followed 10,311,063 individual homes from one sale to the next.
- •Homes with five or more sales since 1995 grew about 3.8 percentage points less than matched homes with only two sales, roughly £7,200 on a typical purchase price.
- •Each extra sale on the record adds to the gap. Twice-sold homes ran 3.62 points ahead of their local benchmark; homes with seven or more sales ran 1.90 points behind.
- •Frequently traded homes were nearly twice as likely to sell below what the owner paid: 7.31% against 3.87% for sales completing since 2015.
- •The gap is positive in all 395 districts with enough sales to test, and it has widened from 1.6 points in 2000 to 5.8 points in 2025.
Advertisement

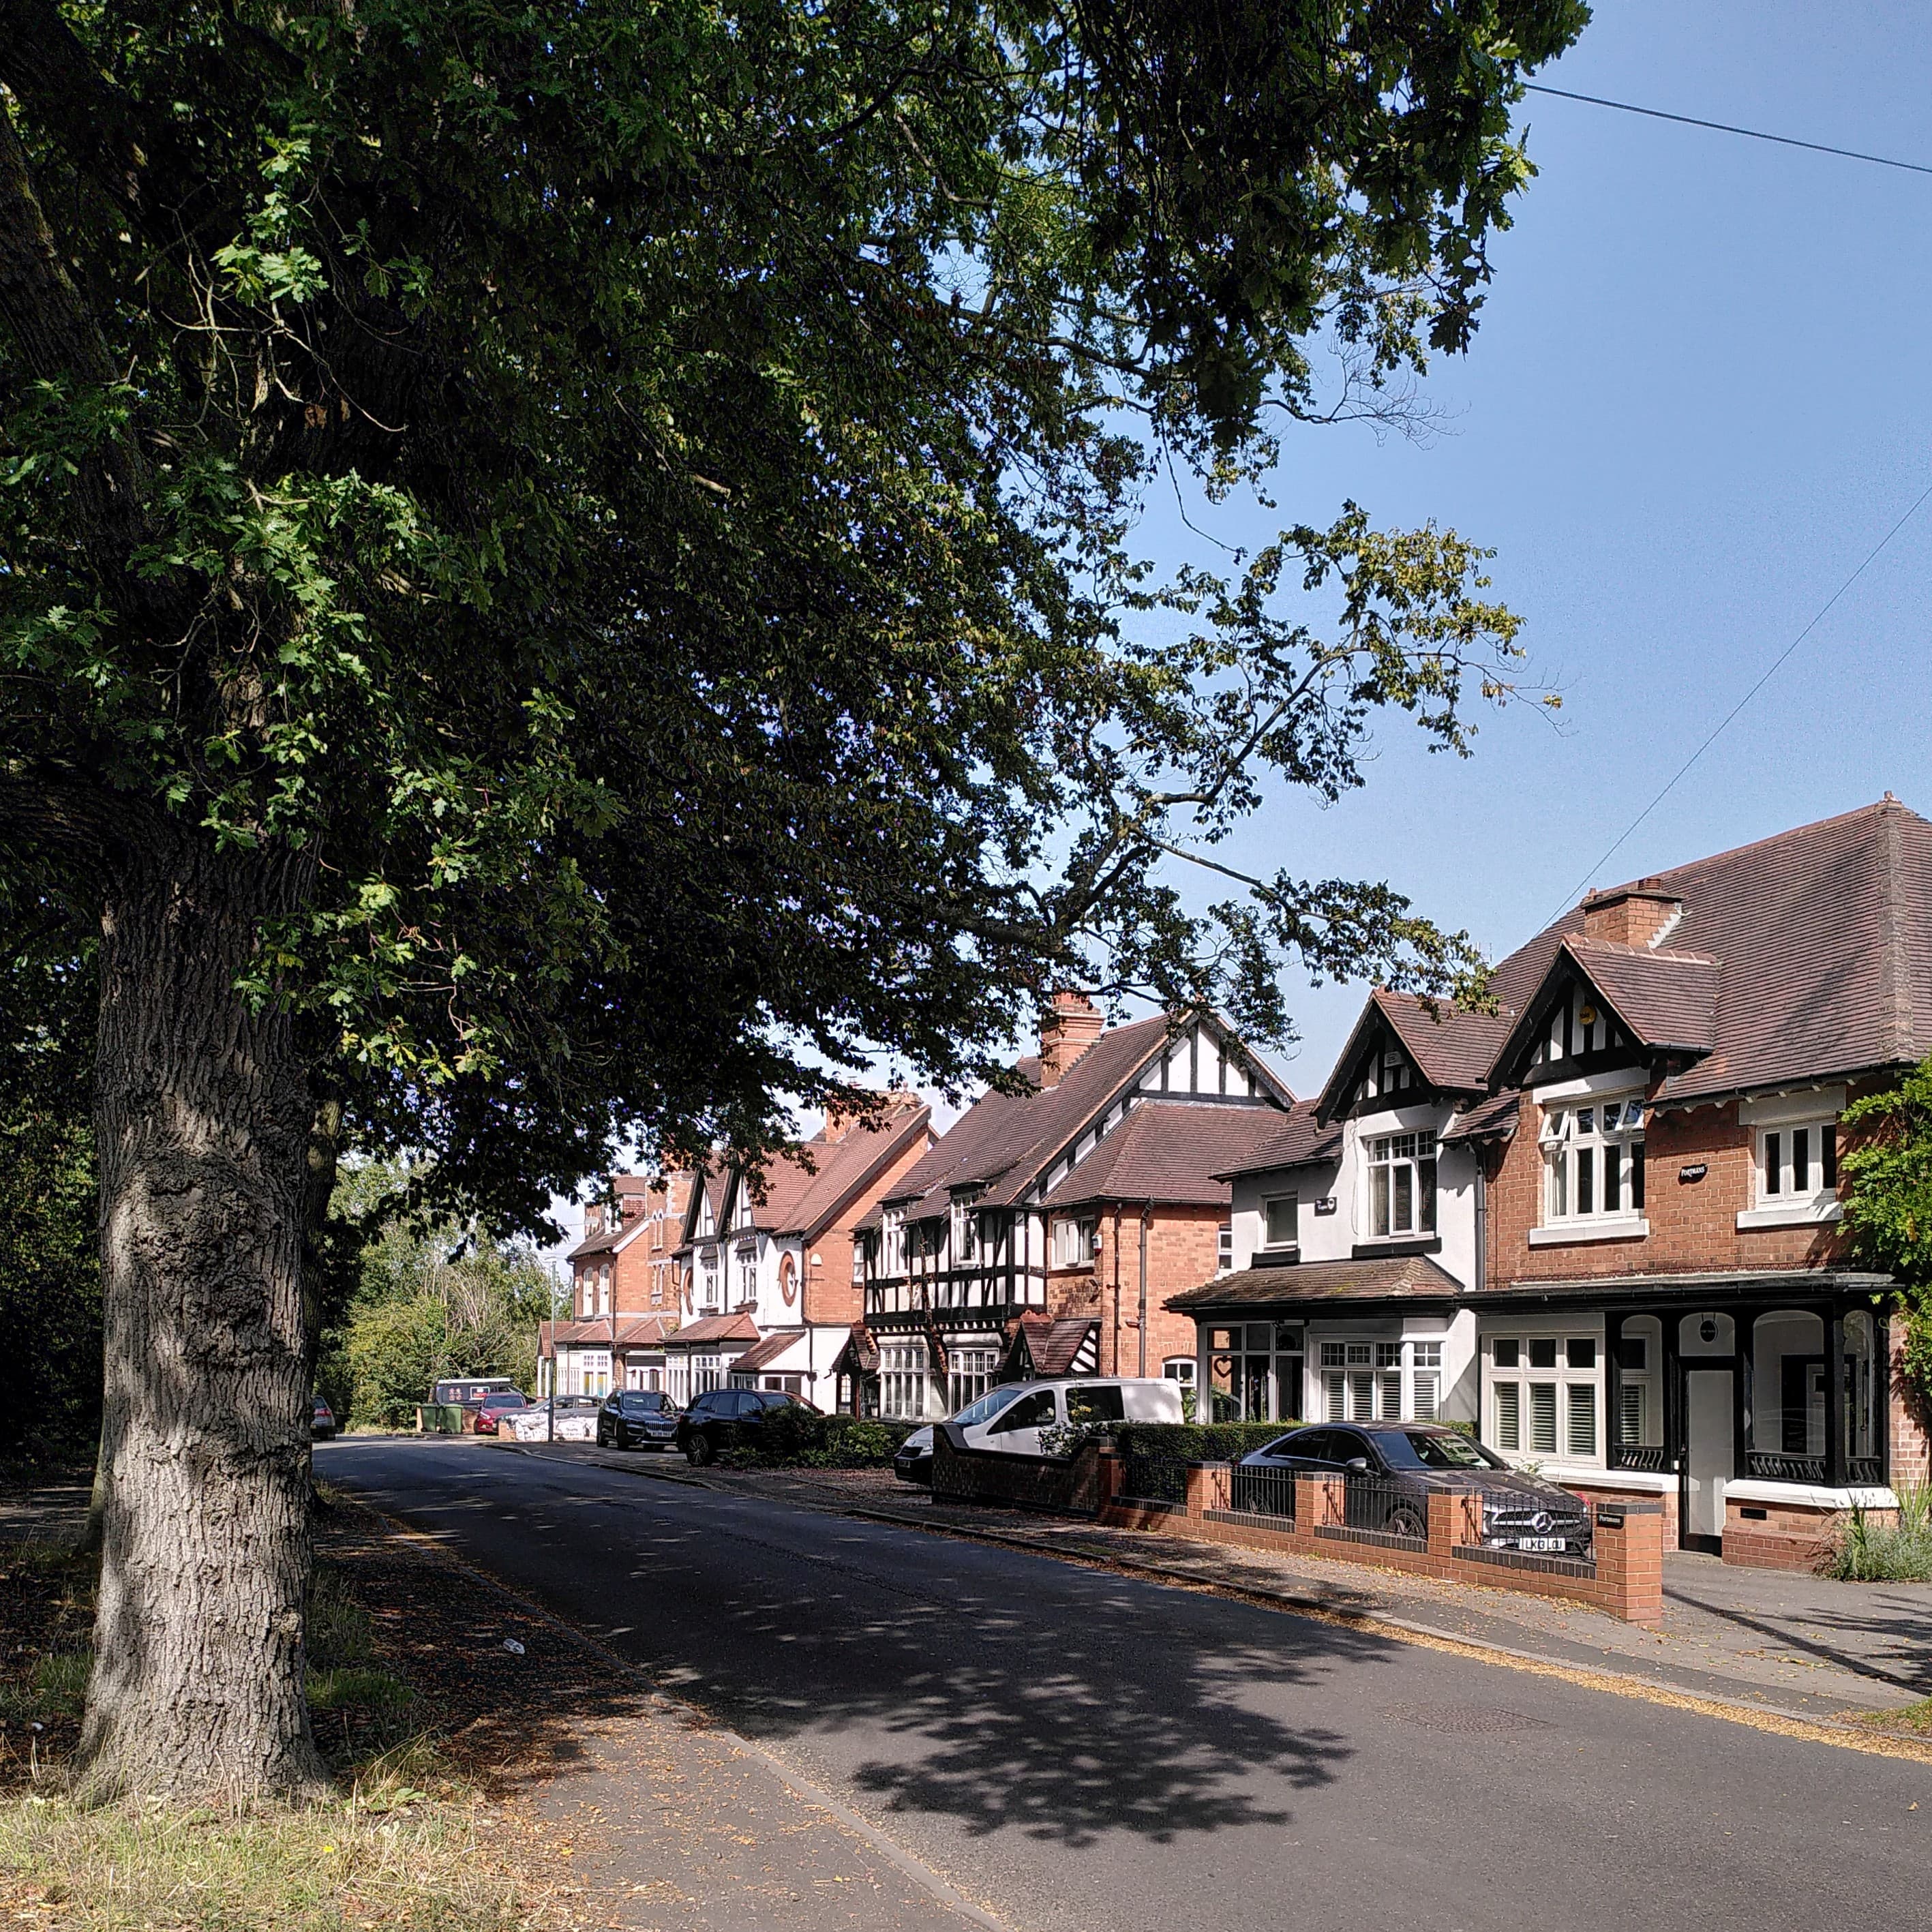
Research by ValuQ: we analysed 29,525,866 completed property sales from HM Land Registry Price Paid records, then followed 10,311,063 individual homes from one sale to the next, to measure what a busy sale history does to the price a home achieves.
A home in England and Wales that has changed hands five times or more since 1995 has grown about 3.8 percentage points less than a like-for-like home in the same district, of the same type, bought and sold in the same years, that changed hands only twice. On the £189,000 median purchase price of those frequently traded homes since 2020, that is roughly £7,200 of gain that never arrived.
Housing economists have known for decades that homes appearing in repeat-sales data are not a random slice of the housing stock, and the literature treats it as a problem to correct out of a national price index. It asks what churn does to the measurement. Nobody has asked what churn does to the owner. That is the question here.
Every extra sale leaves a home further behind
Each home was compared against the median price change of every home sharing its district, property type, purchase year and sale year. Because the purchase year and the sale year are both fixed, the length of ownership and the market cycle are controlled by construction. What is left is the home itself.
ValuQ analysis of HM Land Registry Price Paid Data, completions 1 January 1995 to 31 December 2025.
| Sales at that address since 1995 | Homes followed | How it did against its local benchmark | Median time owned |
|---|---|---|---|
| 2 | 3,001,294 | +3.62 points | 7.9 years |
| 3 | 3,361,128 | +0.61 points | 6.2 years |
| 4 | 2,209,888 | -0.49 points | 5.2 years |
| 5 | 1,098,735 | -1.13 points | 4.5 years |
| 6 | 439,995 | -1.53 points | 4.0 years |
| 7 or more | 200,023 | -1.90 points | 3.5 years |
The step is steepest at the start and it keeps going. Frequently traded homes appear in the data more than once, so the headline figure in this study uses the stricter version: one sale pair per address, with the gap estimated across 200 separate random subsamples. That gives 3.8 points, with the twice-sold homes ahead in 200 subsamples out of 200.
The pattern is visible before you buy
Nobody can know how often their home will sell in future. Anyone can look up how often it has sold already, on any sold-price website. Counting only the sales recorded before the owner bought produces the same pattern.
ValuQ analysis of HM Land Registry Price Paid Data.
| Sales recorded before the owner bought | Homes followed | How it did against its local benchmark |
|---|---|---|
| None | 5,413,918 | +3.09 points |
| 1 | 3,077,486 | -1.28 points |
| 2 | 1,220,525 | -1.71 points |
| 3 | 424,427 | -1.92 points |
| 4 or more | 174,707 | -2.02 points |
Part of that first step is a separate story. A home with no prior sale on the register is a home coming to market for the first time in at least a decade, often un-modernised and often bought below what it will be worth once the work is done. The steps after it cannot be explained that way, and they run in the same direction.
Nearly twice as likely to sell at a loss
Among sales completing since 2015, 7.31% of the frequently traded homes came back below what their owner paid, against 3.87% of the twice-sold homes. The gap also survives every check we ran: houses only, holdings of four to eight years, holdings of ten years or more, sales completing since 2020, and residuals trimmed at the top and bottom one per cent. Sorting homes into five bands by purchase price relative to their local market, the pattern runs the same way inside all five.
Where the gap is widest
ValuQ analysis of HM Land Registry Price Paid Data. Districts with at least 200 sale pairs in each group. Figures are percentage points against each home's local benchmark.
| District | Twice-sold homes | Five or more sales | Gap |
|---|---|---|---|
| Hackney | +12.86 | +1.47 | 11.39 points |
| Brighton and Hove | +10.44 | -0.35 | 10.80 points |
| Rossendale | +10.47 | -0.23 | 10.71 points |
| Thurrock | +10.91 | +0.67 | 10.24 points |
| Trafford | +9.77 | +0.03 | 9.74 points |
| Southend-on-Sea | +10.84 | +1.14 | 9.69 points |
| Basildon | +6.52 | -0.29 | 6.81 points |
| Croydon | +0.08 | -0.99 | 1.07 points |
| Blackpool | -7.85 | -8.07 | 0.22 points |
Across all 395 districts with enough sales to test, the gap is positive in every single one, with a median of 5.15 points. In Blackpool and Redcar and Cleveland it narrows because both groups sit behind their national benchmark, not because busy sale histories stop mattering there. Basildon, where ValuQ runs its pilot, sits at 6.81 points, wider than the typical district, and 4.27% of its addresses have sold five times or more.
Why some homes turn over so fast
Frequently traded homes are more likely to be flats (27.4% against 12.9% of twice-sold homes) and more likely to be leasehold (31.4% against 17.6%). The mix is not the whole story: the gap appears inside every property type and tenure combination with enough sales to test, including freehold detached houses, where twice-sold homes ran 4.52 points ahead and frequently traded ones 1.24 points behind.
- Something about the building keeps sending owners away: a lease with a problem, a service charge that climbs, a road that got busier, a layout nobody lives with twice.
- A run of short ownerships means nobody ever spends money on the roof, the windows or the kitchen, so the home slowly falls behind its street.
- Some churn is nothing to do with the property. A block of small flats near a hospital or a university turns over quickly because the people in it move on quickly, and those homes can be perfectly good.
What this means if you are selling
1. Look up your own sale history first
Every sold-price website carries it, and every serious buyer will find it. If your address shows five completions since 1995, the market has already seen four people decide to leave. Know that before you pick a number, not after the second reduction.
2. Price against the pattern, not the street average
The frequently traded homes in this study still sold. They sold at a price about four points below what the same type of home in the same district achieved over the same years. Anchoring on the street average and refusing to move is what turns one reduction into two.
3. Have the explanation ready
If the churn has an innocent cause, say so plainly in the listing and at the viewing. A short, honest answer beats a buyer inventing a worse one from the sold-price page.
4. Get more than one experienced local opinion
An agent who has worked that street for years knows exactly why a particular house keeps coming back, and whether it applies to yours. That knowledge belongs to you, not to whoever happens to value the property first.
5. If your home has been steady, use it
Twice-sold homes beat their matched benchmark by three to four points. Long ownership on a street is a signal buyers respond to, and it is a signal you can point at.
A frequently traded home is worth a real amount less than the house next door that has stayed put, and almost nobody selling one is told that before they pick a price. They find out three months later, after the second reduction.
Evren Ergin, founder of ValuQ
How we did this
ValuQ analysed the complete HM Land Registry Price Paid file, downloaded on 16 July 2026 and covering completions from 1 January 1995 to 29 May 2026, England and Wales only. After filtering to standard residential sales, that is 29,525,866 sales at 15,710,347 distinct addresses. Each sale was matched to the previous sale at the same address, keeping pairs where both legs are the same property type, both are existing stock rather than a new build, the two sales are at least a year apart, and each price sits between 50% and 250% of the local median for that district, type and year, which removes part-share sales. That gives 10,311,063 pairs at 6,407,665 addresses, with a median ownership of 5.9 years. Every pair was then compared against the median price change of all pairs sharing its district, property type, purchase year and sale year.
Where this could be wrong
This is an association measured across millions of homes, not an experiment. Homes may sell often because they disappoint, or they may disappoint because a run of short ownerships means nothing ever gets replaced, and the data cannot separate the two. Price Paid covers England and Wales only and leaves out transfers that are not standard sales, so a home can change owner without appearing. A home built after 1995 has had fewer years to build a record, so the count of sales is a floor rather than a census.
Does it matter how many times a house has been sold?
On the evidence here, yes, though not dramatically. Homes with five or more sales since 1995 grew about 3.8 percentage points less than matched homes with only two, roughly £7,200 on a typical purchase price. It is a tilt in the odds, not a verdict on any individual home.
How can I find out how many times a home has been sold?
HM Land Registry Price Paid data is free and public, and every major property website shows the sale history for an address going back to 1995. Look it up before the second viewing rather than after the survey.
Is a frequently sold house always a bad buy?
No. Some homes turn over quickly for reasons that have nothing to do with the property, such as a block of small flats where people move on after a couple of years. Read the sale history alongside the physical facts, and ask a local agent who was working that street at the time.
Which areas show the widest gap?
Hackney at 11.39 points, then Brighton and Hove at 10.80 and Rossendale at 10.71. The gap is positive in all 395 districts with enough sales to test, with a median of 5.15 points.
Does ValuQ charge homeowners?
No. ValuQ is free for homeowners, always. Sellers and buyers never pay, there are no fees and no data sales.
This is part of ValuQ Property Watch, our running series of original research on the UK housing market. ValuQ gives UK homeowners free, side-by-side property valuations from competing local estate agents, with the seller staying anonymous until they choose otherwise.
Sources
- [1]HM Land Registry Price Paid Data (complete file) · 2026-07-16 · https://www.gov.uk/government/statistical-data-sets/price-paid-data-downloads
- [2]ONS, Housing affordability in England and Wales: 2025 · 2026-03-26 · https://www.ons.gov.uk/peoplepopulationandcommunity/housing/bulletins/housingaffordabilityinenglandandwales/2025
- [3]Gatzlaff and Haurin, Sample Selection Bias and Repeat-Sales Index Estimates, Journal of Real Estate Finance and Economics 14(1-2), 33-50 · 1997-01-01 · https://doi.org/10.1023/A:1007763816289
- [4]Melser, Selection Bias in Housing Price Indexes, Oxford Bulletin of Economics and Statistics 85(3), 623-637 · 2022-12-07 · https://doi.org/10.1111/obes.12534
Terms in this article
Plain-English definitions from the ValuQ property glossary.
HM Land Registry
HM Land Registry is the government body recording ownership of land in England and Wales, whose register is the definitive proof of title.
Service charge
A service charge is the leaseholder's share of the building's running costs: maintenance, insurance, cleaning, lifts and management.
Read next
Related insights
Can I switch estate agent while my house is on the market?
Can my estate agent use AI to edit photos of my house?
A buyer wants to film my house at the viewing. Should I let them?
How do I know if my estate agent is doing enough?
What is your home worth today?
ValuQ gives UK homeowners free, side-by-side property valuations from competing local estate agents. Anonymous until you choose. No cold calls.
Get your free anonymous valuationSellers and buyers never pay.