Leasehold houses that bought their freehold sold 4.2 points ahead. Only 6% did it
Published 1 August 2026 · 10 min read · By Evren Ergin
A house in England or Wales that was leasehold when it was bought and freehold when it was sold grew 4.2 percentage points faster than a comparable house that stayed leasehold, worth about £7,600 on a typical £180,000 sale. Yet only 6.2% of leasehold houses that changed hands twice had bought their freehold in between.
TL;DR
- •ValuQ analysed 8.56 million paired house sales from HM Land Registry records, following each home from one sale to the next.
- •A leasehold house grew about 2.5% less than a comparable freehold house in the same area over the same years, and the gap has roughly tripled since 2012.
- •Houses that bought out their freehold between sales grew 4.2 points more than those that stayed leasehold, around £7,600 on a £180,000 sale.
- •Only 6.2% of leasehold houses that sold twice had gained their freehold in between, so almost 19 in 20 owners never captured that gap.
- •The discount lands at the moment of sale rather than building up over the years you own the home.
Advertisement

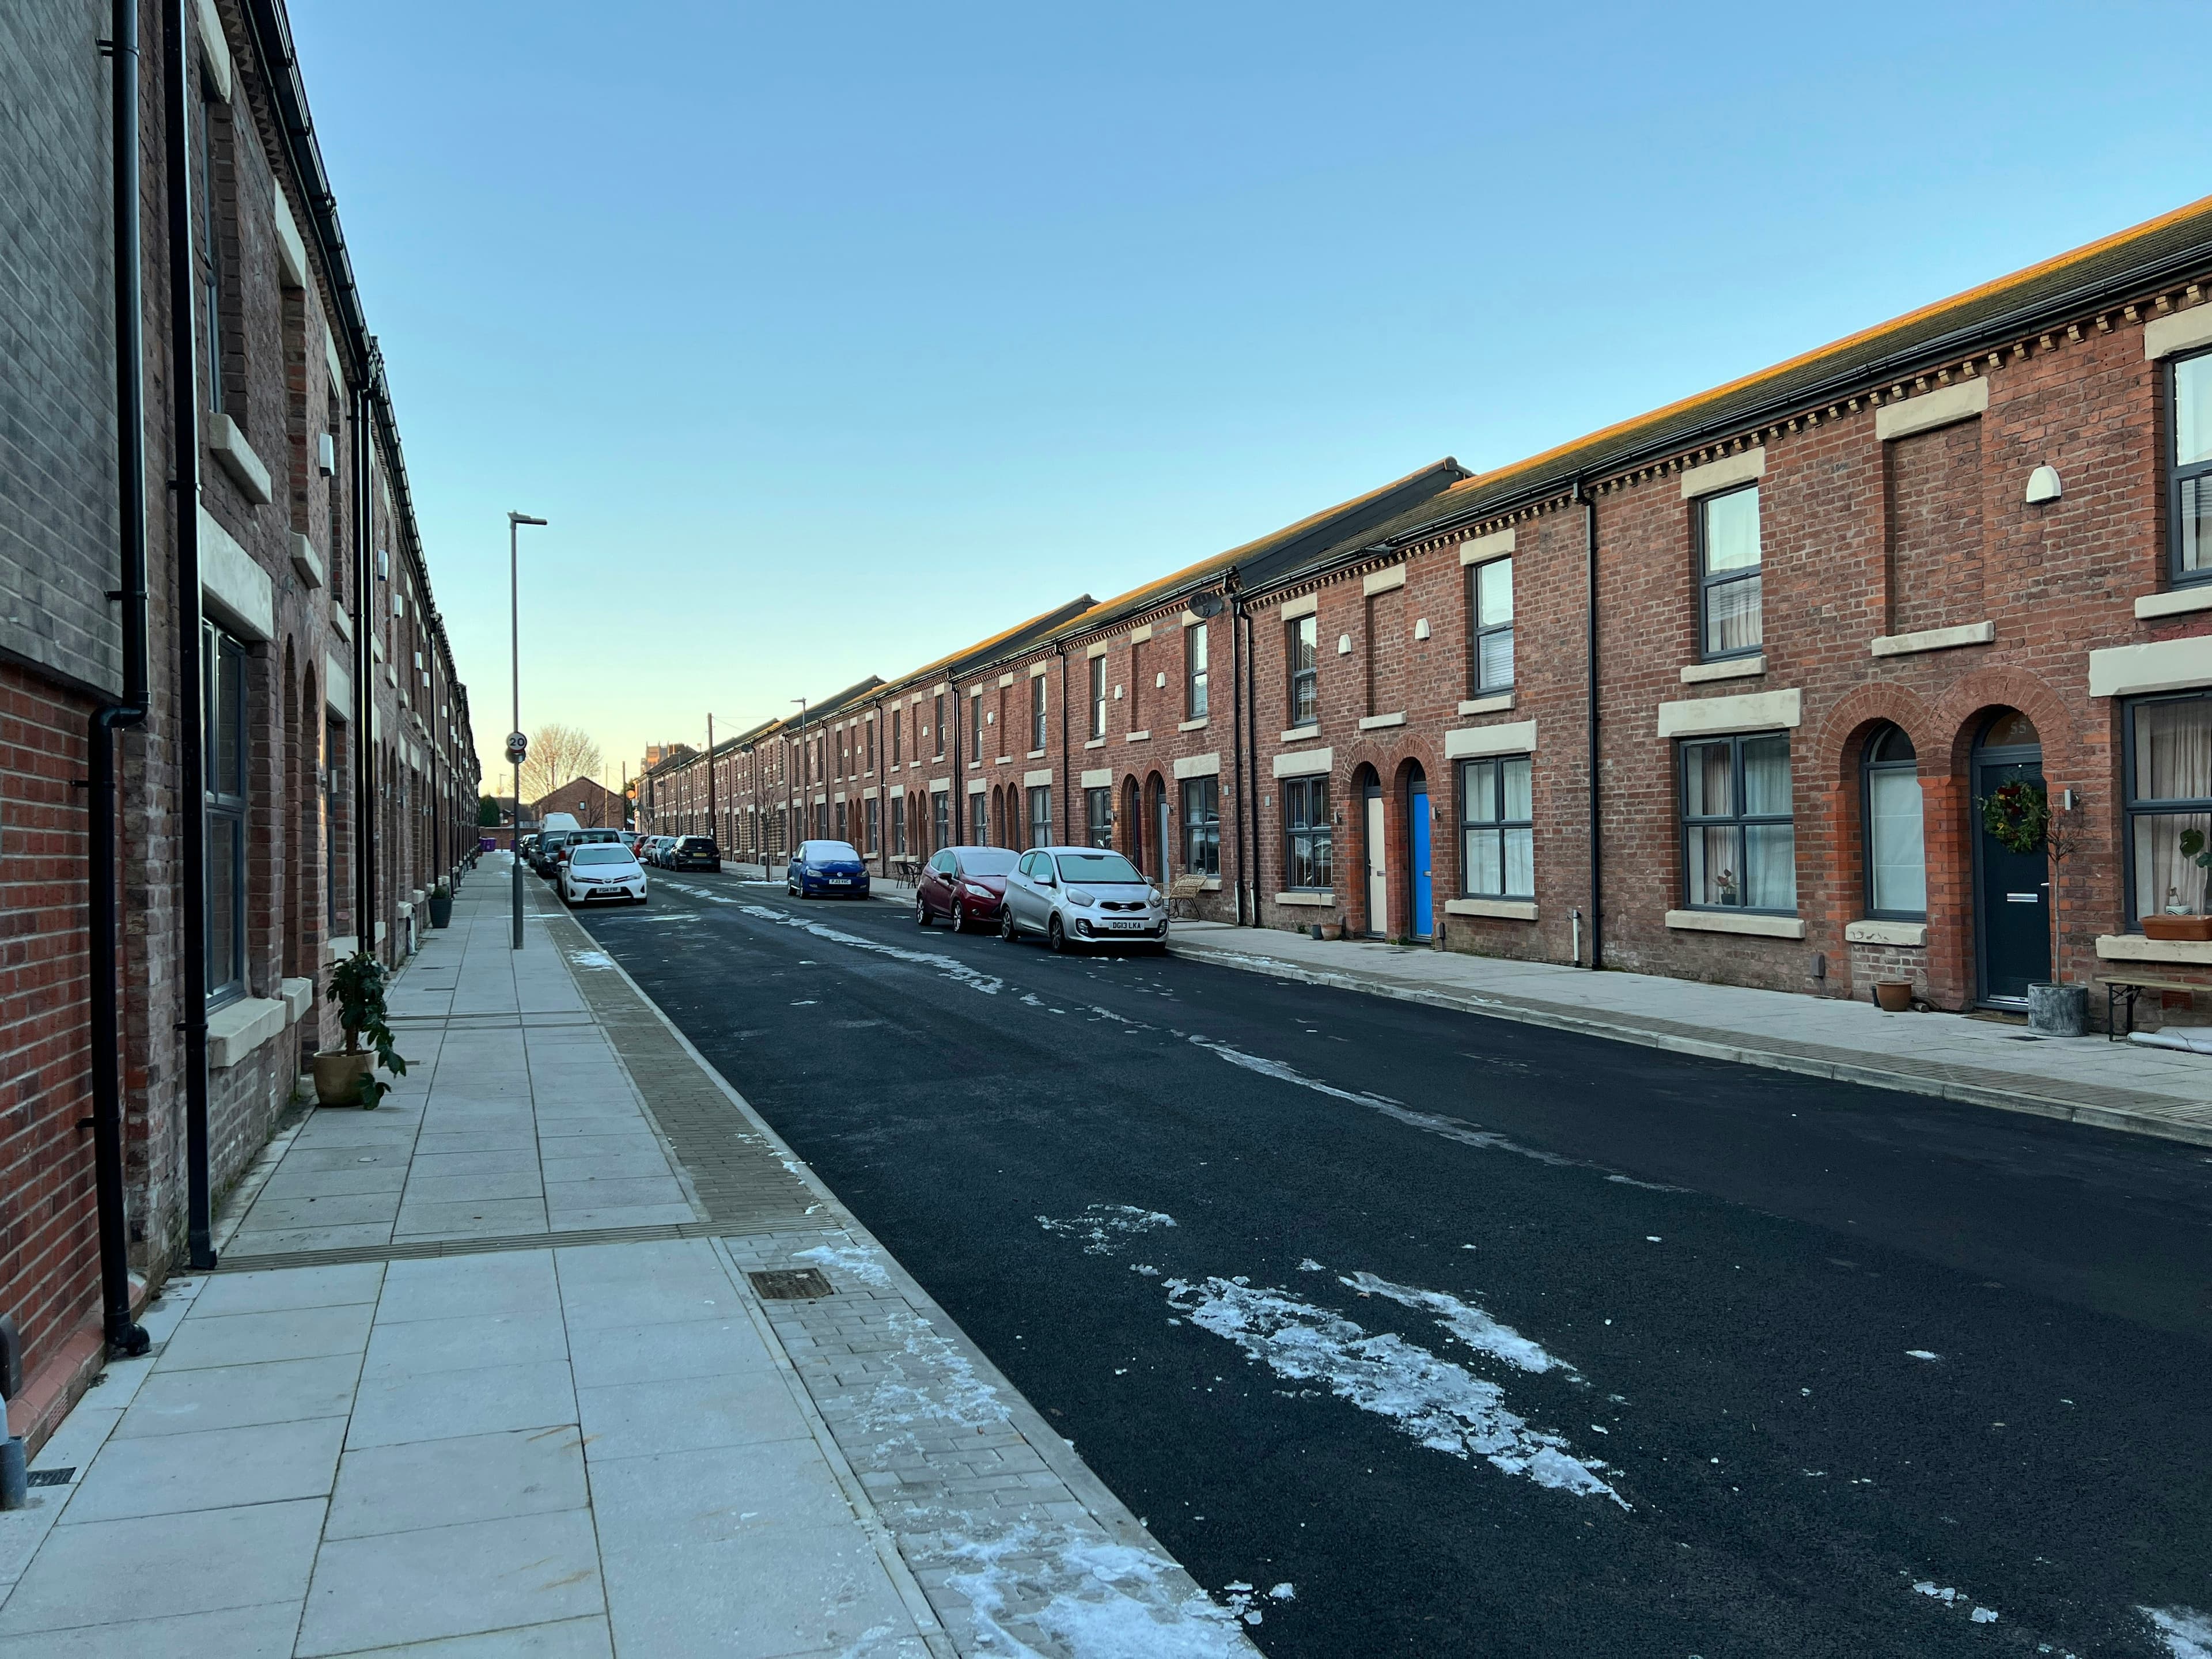
Research by ValuQ: we tracked 8.56 million house sales in England and Wales through HM Land Registry records, following each home from one sale to its next, to measure what the word leasehold actually costs when a house changes hands.
What the record shows
Most houses in England and Wales are freehold, which means you own the property and the land under it outright. A minority are leasehold, which means someone else owns the land and you own the right to live there for a set number of years. Since 1995, 954,253 separate houses have sold at least once as a leasehold, across 1,663,107 sales. It is a small share of the market and a large number of families.
To measure the effect we compared each home against its own local market. Every sale was scored against houses of the same type, in the same postcode district, bought in the same year and sold in the same year. That way the comparison is not London against Bolton, or the 2007 peak against the 2021 boom. Zero in the table below means a home grew exactly in line with the freehold houses around it.
ValuQ analysis: growth against the local market by tenure path (HM Land Registry Price Paid Data, 8.56 million paired house sales, 1995 to May 2026)
| What the house was at each sale | Number of sales pairs | Growth against its local market |
|---|---|---|
| Freehold when bought, freehold when sold | 8,014,513 | 0.0% |
| Leasehold when bought, freehold when sold | 33,531 | +1.8% |
| Leasehold when bought, leasehold when sold | 504,633 | -2.5% |
| Freehold when bought, leasehold when sold | 8,977 | -2.7% |
Read the last column and one pattern runs through it. A house that was freehold at the sale being measured grew in line with its market or a little better. A house that was leasehold at that sale came in about 2.5% behind, and it made very little difference what it had been when it was bought. The discount is applied on the day the house changes hands, not gradually across the years you live there.
The gap between the two leasehold starting points is the number that matters to an owner. Houses that had gained their freehold in between their two sales grew 4.2 percentage points more than houses that stayed leasehold. On the median sale price in that group, £180,000, the gap is worth about £7,600. It holds for every house type: 4.0 points for detached homes, 3.4 for semi-detached and 5.7 for terraced.
The penalty has got worse since 2012
The 2.5% figure is an average across three decades, and it has not held still. Through the late 1990s and 2000s a leasehold house gave up a little over a point against its freehold neighbours. From 2012 it roughly tripled.
ValuQ analysis: how far leasehold houses fell behind their local freehold market, by the period in which they sold
| When the house sold | All leasehold houses | Excluding new builds |
|---|---|---|
| 1997 to 2004 | -1.4 points | -0.9 points |
| 2005 to 2011 | -1.2 points | -0.7 points |
| 2012 to 2018 | -3.5 points | -2.7 points |
| 2019 to 2026 | -3.2 points | -2.3 points |
The right-hand column strips out every home whose first sale was a new build, because leasehold new build houses and their ground rent terms were the subject of a long-running controversy in the mid 2010s. The penalty still roughly triples either way, so this is not only a new build story. We can date the change with confidence. We cannot prove from sales records alone what caused it.
The penalty also grows with the price of the house. On homes bought for under £50,000 it is 2.2 points. Above £300,000 it is 4.0 points. In percentage terms, buyers discount leasehold more the more house they are buying.
Almost nobody buys their freehold
Of the 538,164 house sale pairs that started out leasehold, only 33,531 ended up freehold. That is 6.2%. Almost 94% of leasehold houses that changed hands twice were still leasehold the second time.
This is the part worth sitting with. The gap those owners captured was worth roughly £7,600 on a typical sale, and 19 out of 20 owners did not capture it. In most cases that is not a decision someone weighed and turned down. It is a sum nobody ever put in front of them.
Where leasehold houses actually are
Leasehold houses are concentrated, not spread evenly. Across England and Wales they are 5.9% of house sales since 2020, down from 7.1% in the late 1990s. In parts of the North West they are the normal way of owning a home: 67% of house sales in the Bolton postcode area, 60% in Oldham, 50% in Wigan, 48% in Blackburn and 37% in Manchester.
ValuQ analysis: growth against the local market for leasehold houses, by postcode area (areas with at least 150 enfranchised sales)
| Postcode area | Bought the freehold | Stayed leasehold |
|---|---|---|
| Sheffield (S) | +5.6% | +3.1% |
| Bolton (BL) | +3.9% | -1.4% |
| Liverpool (L) | +3.3% | -4.2% |
| Bristol (BS) | +3.0% | +0.8% |
| Blackburn (BB) | +2.4% | -2.5% |
| Warrington (WA) | +2.3% | -2.9% |
| Manchester (M) | +1.9% | -4.8% |
| Cardiff (CF) | +1.5% | -1.8% |
| Birmingham (B) | +1.3% | -2.2% |
| Preston (PR) | +1.2% | -3.3% |
| Oldham (OL) | -0.4% | -3.4% |
| Swansea (SA) | -1.3% | -5.2% |
| Newcastle (NE) | -1.6% | -4.1% |
| Wigan (WN) | -2.7% | -3.2% |
The first column sits above the second in 42 of the 43 postcode areas with enough cases to measure. Sunderland is the single exception. The size of the gap varies a great deal by place, which is why the table is here rather than one national average.
What this means if you are selling
- The discount arrives on the day you sell, not slowly while you own. If your house is leasehold, the record says the market has taken about 2.5% off it relative to the freehold house of the same type in the same area, and closer to 3% over the last decade.
- Buying out the freehold has moved the number by about 4 points. Whether that is worth doing depends entirely on what your freeholder wants for it, and no dataset can tell you that. Our figure is the resale side of the sum. The cost side is a quote you have to go and get.
- Expect a tilt, not a transformation. Just over half of the homes that bought their freehold beat their local market, against 44% of those that stayed leasehold. It shifts the odds by around ten points. It does not decide the outcome of one sale, because condition, street, timing and negotiation all sit on top of it.
- Get more than one view of the price. A leasehold house is harder to value than a freehold one, because so much depends on the lease, the ground rent and how a particular buyer's lender treats it. That is exactly the kind of home where two agents can land thousands apart.
Nobody sends you a letter about what your tenure costs. It shows up once, in the offer, at the moment you have the least room to do anything about it.
The legal route to buying a freehold, what it costs and whether you qualify are questions for a solicitor or a surveyor. This article is a description of how the market has priced tenure over thirty years, published so you walk into that conversation knowing the pattern rather than guessing at it. It is not financial or legal advice.
How we worked it out
We took the full HM Land Registry Price Paid file, covering 29.5 million standard residential sales in England and Wales from January 1995 to May 2026, and matched each sale to the next sale at the same address. That gives 11.5 million paired sales, of which 8.56 million are houses once cleaned. Every pair was measured against the median growth of freehold houses of the same type, in the same postcode district, bought and sold in the same years, so that holding period and the state of the market are held steady.
Two checks shaped the result. We removed sales that sit far outside the normal price range for their type, district and year, because shared ownership can look like a tenure change in the raw data when a part share is sold first and the whole house later. And we ran the test in reverse on houses recorded freehold then leasehold. If the pattern were down to record-keeping errors, both switch groups would sit near zero. Instead the reverse group mirrors the stayed-leasehold group, which is what a genuine discount applied at the point of sale looks like.
One limit is worth stating plainly. Owners are not assigned their tenure at random, and people who buy out a freehold may be people who spend on their homes in other ways too. This is a strong association measured across 33,531 sales, not a controlled experiment.
Common questions
Does leasehold really reduce what my house is worth?
On the Land Registry record, yes, and it shows up as slower growth between sales. A leasehold house grew about 2.5% less than a comparable freehold house in the same postcode district over the same years, and about 3% less over the last decade. That is an average across hundreds of thousands of sales, so any individual home can sit either side of it.
How much does buying my freehold add to the sale price?
Houses that gained their freehold between two sales grew 4.2 percentage points more than houses that stayed leasehold, which is about £7,600 on the median £180,000 sale in that group. That figure is measured before whatever the owner paid the freeholder, which the Land Registry does not record, so it is one side of the sum rather than a net gain.
Why do so few leasehold houses become freehold?
The data cannot say why, only that it is rare: 6.2% of leasehold houses that sold twice had gained their freehold in between. The process costs money and takes time, and for most owners the sum has simply never been put in front of them in pounds.
Are leasehold houses becoming less common?
Slowly. They were 7.1% of house sales in England and Wales in the late 1990s and 5.9% since 2020. They remain the normal way of owning a house in parts of the North West, where more than half of house sales in some postcode areas are leasehold.
What is a repeat sale, and why measure that way?
A repeat sale is the same address appearing twice in the Land Registry record, so the growth measured is that one property's own growth. Comparing average leasehold and freehold prices instead would mostly compare flats with houses, because most leasehold homes are flats. Following the same house through two sales removes that problem.
ValuQ gives UK homeowners free, side-by-side property valuations from competing local estate agents, so a seller can compare what several agents think their home is worth before committing to any of them. On a home where tenure makes the price harder to judge, seeing those valuations next to each other is worth more than a single confident figure.
Sources
- [1]HM Land Registry Price Paid Data (complete file) · 2026-07-16 · https://www.gov.uk/government/statistical-data-sets/price-paid-data-downloads
- [2]Leasehold and Freehold Reform Act 2024 (legislation.gov.uk) · 2026-07-29 · https://www.legislation.gov.uk/ukpga/2024/22/contents
- [3]Pre-legislative scrutiny of the draft Commonhold and Leasehold Reform Bill, UK Parliament · 2026-05-27 · https://publications.parliament.uk/pa/cm5902/cmselect/cmcomloc/40/report.html
Terms in this article
Plain-English definitions from the ValuQ property glossary.
Shared ownership
Shared ownership is buying a share of a home, commonly between 10% and 75%, and paying rent on the rest to a housing association.
HM Land Registry
HM Land Registry is the government body recording ownership of land in England and Wales, whose register is the definitive proof of title.
Leasehold house
A leasehold house is a house sold on a lease rather than freehold, a structure with little justification that new legislation has moved to ban for new sales.
Ground rent
Ground rent is the annual payment a leaseholder makes to the freeholder simply for occupying the land, distinct from service charges.
Freeholder
The freeholder is the ultimate owner of a leasehold building's land and structure, the landlord the lease answers to.
Read next
Related insights
Buyer wants to exchange and complete same day. Should I agree?
My estate agent asked for my lowest price. Should I tell them?
What is a completion statement when selling a house?
Detached homes sell at a loss 60% more often than semis
See every local agent on one screen.
Free for homeowners. Always. No cold calls. No data sales. No starting-line advantage for the fastest dialler in town.
Get your free anonymous valuationSellers and buyers never pay.