Detached homes sell at a loss 60% more often than semis
Published 12 September 2026 · 8 min read · By Evren Ergin
Detached houses bought in the 2021 to 2023 boom have been selling below their purchase price 14.9% of the time, against 9.1% for semi-detached homes, according to ValuQ analysis of 78,815 matched Land Registry sales. The gap holds in every region of England and Wales, and it widens sharply above £450,000.
TL;DR
- •ValuQ matched 78,815 homes bought between 2021 and 2023 and sold again in the year to 31 May 2026, and 13.1% of them sold for less than the owner paid.
- •Detached houses sold at a loss 14.9% of the time, around 60% more often than semi-detached homes at 9.1%, with a typical loss of £22,000 against £13,000.
- •Above £700,000 a detached home sold at a loss nearly twice as often as a terraced home bought for the same money.
- •The detached gap appears in all ten regions of England and Wales and in every quarter since the start of 2024.
Advertisement

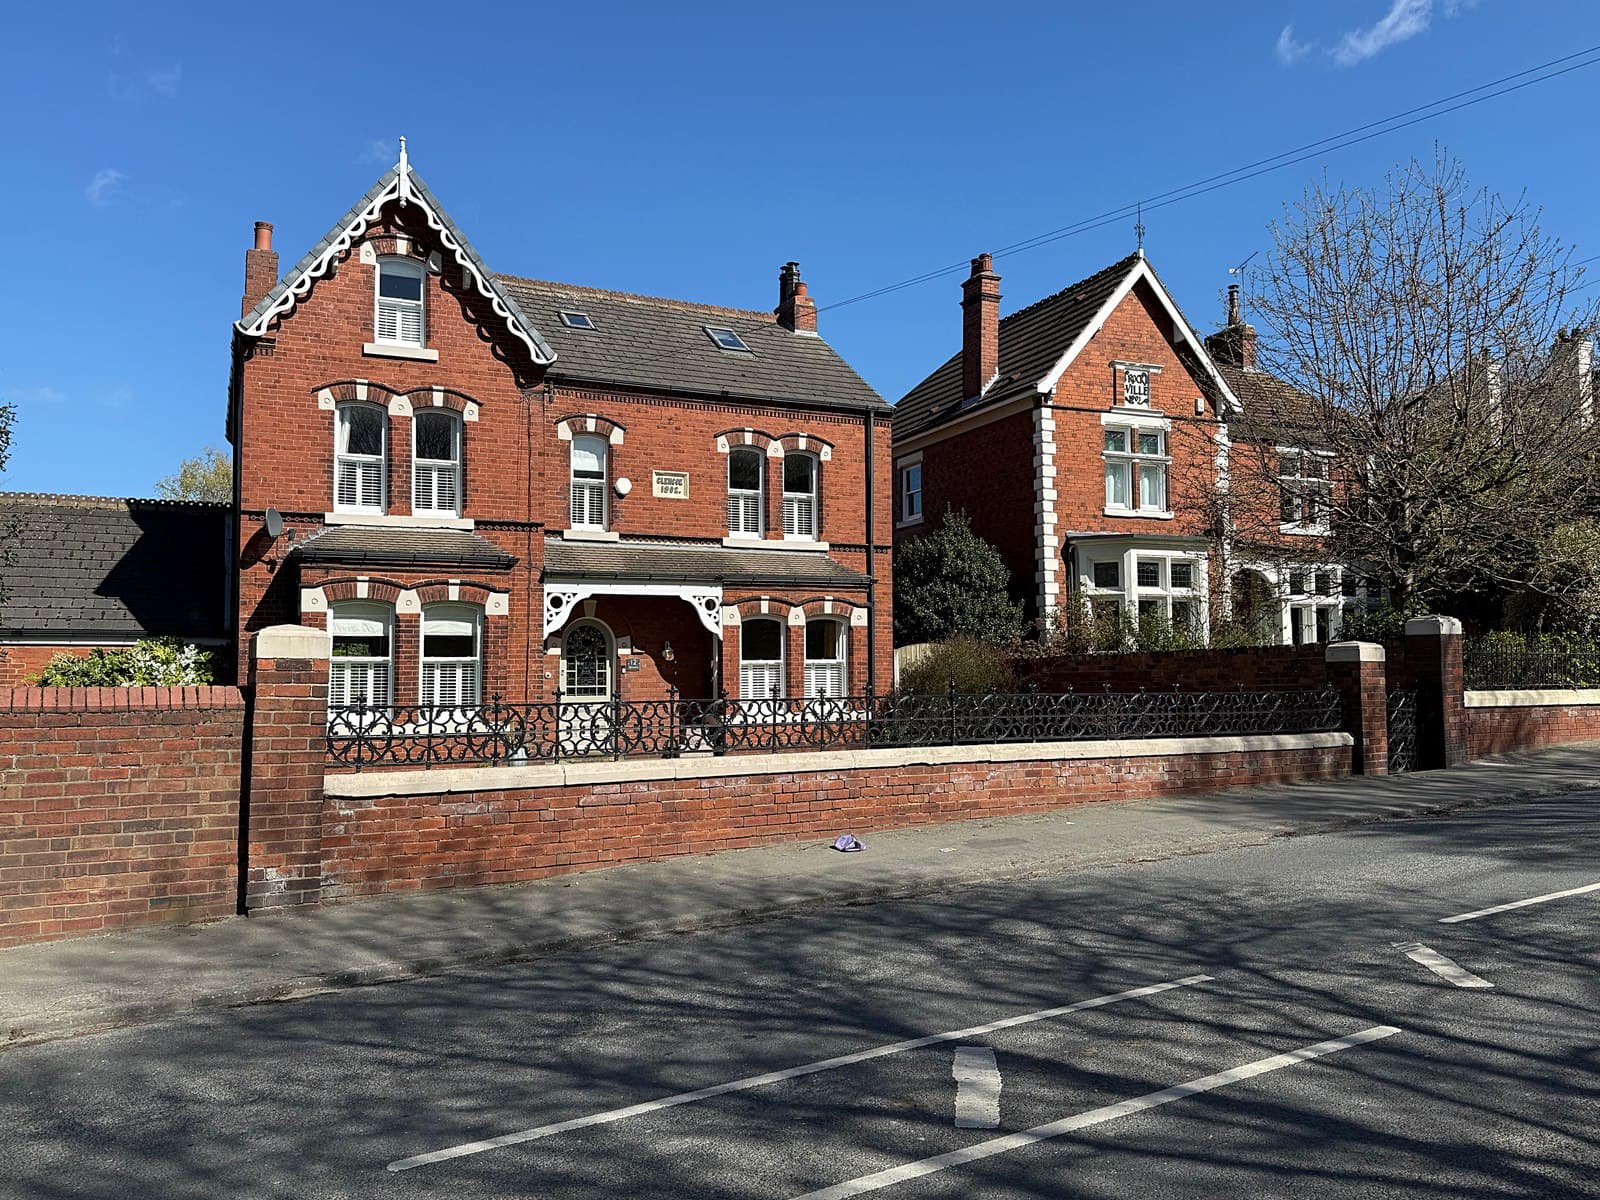
Research by ValuQ: we matched 78,815 homes in England and Wales that were bought between 2021 and 2023 and sold again in the year to 31 May 2026, comparing each sale price against what the same owner paid for the same address.
Why does this matter right now?
On 7 September 2026 the Lloyds House Price Index reported that the average home fell 0.2% in August to £298,468, the first annual fall in UK house prices since November 2023. The same morning RICS put its house price balance at minus 28 for August, with buyer enquiries improving for a fifth month. Moneyfacts figures published the same day had the average two year fixed mortgage back up at 5.63%, with five year swap rates above 4.5% for the first time in about three years.
Those readings describe the market in the aggregate. They do not tell an owner which homes are carrying the falls. Land Registry records can, because they hold the price of the same address at two points in time, which is what this research is built on.
What did the data actually show?
Across those 78,815 resales, 13.1% went for less than the owner paid. The typical outcome was a gain of 11.4%, so most owners still came out ahead. The losses were not spread evenly, and they were not where the property industry usually points.
Split by the kind of home, the detached house stands out. A detached home sold at a loss 14.9% of the time. A semi-detached home sold at a loss 9.1% of the time. That is a detached owner running into a loss around 60% more often than the owner of the semi next door, over the same period, with the same average length of ownership of just under four years.
ValuQ analysis: homes bought 2021 to 2023, resold in the year to 31 May 2026 (England and Wales, excluding homes bought new)
| Type of home | Sales analysed | Sold below what the owner paid | Typical loss when it happened | Typical outcome overall |
|---|---|---|---|---|
| Flat or maisonette | 15,417 | 23.1% | £13,500 | +6.1% |
| Detached house | 14,543 | 14.9% | £22,000 | +11.4% |
| Terraced house | 25,735 | 9.7% | £11,250 | +13.0% |
| Semi-detached house | 23,120 | 9.1% | £13,000 | +13.8% |
Flats came off worst of all, at 23.1%. That part is well known and widely reported. The detached number is the one nobody has been saying out loud, because it cuts against the oldest instinct in British property: that the bigger the house, the safer the money.
Everyone assumes the family house is the safe end of the market and the flat is the risky end. For anyone who bought at the top and has had to sell, the big house has been the harder ride, and the losses attached to it are far larger in cash. Evren Ergin, founder of ValuQ
Is this just because detached homes cost more?
Price explains part of it, and we tested that directly. We grouped every sale by what the owner originally paid, then compared the types inside each price band. Below £300,000 a detached home is as safe as anything else on the street. Above £450,000 the gap opens and keeps opening.
ValuQ analysis: share of resales that sold below the price the owner paid, by original purchase price and type of home
| What the owner paid | Detached | Semi-detached | Terraced | Flat |
|---|---|---|---|---|
| Under £200,000 | 5.6% | 4.6% | 6.7% | 20.3% |
| £200,000 to £300,000 | 8.8% | 9.4% | 11.7% | 28.1% |
| £300,000 to £450,000 | 14.3% | 13.8% | 13.2% | 25.3% |
| £450,000 to £700,000 | 20.6% | 15.8% | 12.8% | 21.4% |
| £700,000 and above | 27.4% | 16.4% | 14.3% | 26.1% |
At £700,000 and above, a detached house sold at a loss nearly twice as often as a terraced house that cost the same money. So this is not only a story about expensive homes. At the same price, in the same market, the detached house has been the weaker hold.
The reasons are ordinary once you see the numbers. A detached home at £500,000 is usually bought with the largest mortgage on the street, by a buyer whose borrowing power has been cut hardest by the last three years of rates. Its buyer pool is thinner, its price is set by fewer comparable sales, and there is more of it to argue over at survey stage.
Is this only a southern problem?
No. The pattern holds in every region of England and Wales without exception. The level changes, the gap does not.
ValuQ analysis: homes bought 2021 to 2023 and resold in the two years to 31 May 2026, share selling below what the owner paid
| Region | Detached houses | Semis and terraces |
|---|---|---|
| East of England | 20.1% | 13.0% |
| South East | 19.9% | 12.4% |
| South West | 18.0% | 13.5% |
| London | 16.2% | 8.0% |
| East Midlands | 13.1% | 10.7% |
| Yorkshire and the Humber | 12.2% | 7.5% |
| Wales and other areas | 12.0% | 8.3% |
| West Midlands | 11.5% | 7.0% |
| North East | 10.1% | 7.2% |
| North West | 9.2% | 5.7% |
The gap also holds quarter after quarter. In every one of the nine quarters from the start of 2024 to March 2026, detached resales from this cohort sold at a loss more often than semis and terraces. The overall loss rate reached 14.5% in the first quarter of 2026, the highest of those nine quarters.
Which towns are hardest on detached sellers?
Every region has a town at the top of its own list. These are the worst in each, counting only districts with at least 40 detached resales from the 2021 to 2023 cohort.
ValuQ analysis: the district in each region where detached homes bought 2021 to 2023 most often resold below the purchase price (two years to 31 May 2026)
| Region | District | Detached resales | Sold below what the owner paid | Typical loss |
|---|---|---|---|---|
| South East | Lewes | 64 | 34.4% | £30,000 |
| South West | Torridge | 68 | 33.8% | £25,000 |
| East of England | North Norfolk | 118 | 28.8% | £28,500 |
| East Midlands | South Holland | 165 | 25.5% | £10,000 |
| London | Bromley | 66 | 24.2% | £50,000 |
| Wales and other areas | Plymouth | 88 | 21.6% | £12,500 |
| Yorkshire and the Humber | Kingston upon Hull | 40 | 20.0% | £10,000 |
| North East | Hartlepool | 58 | 17.2% | £10,245 |
| West Midlands | Bromsgrove | 66 | 16.7% | £35,000 |
| North West | Blackpool | 48 | 14.6% | £15,000 |
Basildon in Essex sits in the middle of the national picture, with 20.0% of its detached resales going below the purchase price. Its semis and terraces lost money around 8% of the time.
What does this mean for your own home?
If you bought a detached home between 2021 and 2023, this is the question worth answering before anything else: what is it worth today, against what you paid. Most owners in this group are still ahead. A meaningful minority are not, and almost none of them knew it until an agent stood in their hallway.
The figure that matters is not the national average and not the index. It is what a local agent, looking at your street and the sales around it, would put your home on the market for this month. On ValuQ that costs nothing and takes nothing from you. Multiple local agents give their valuations on one screen, and you stay anonymous until you decide otherwise.
What should a seller do about it?
- Get more than one valuation before you set a price. The wider the home, the wider the honest range between agents, and one number on its own tells you very little.
- Ask each agent which sales they priced you from, and when those sales completed. A valuation built on three sales from 2022 is describing a market that has gone.
- Work out your real net figure, not the headline price. Agent fees, conveyancing and your mortgage redemption all sit between the sale price and the money you keep.
- If your number comes back below what you paid, that is information, not a verdict. Owners who know early can choose to wait, to improve, or to price for a quick and certain sale.
- Move in step with your buyer. Real commitment is a solicitor instructed, searches ordered and a mortgage application in, rather than warm words at a second viewing.
What does it mean if you are buying?
A detached home bought in the 2021 to 2023 window is the most likely home on the street to have an owner sitting on a number they do not want to hear. That does not make it a bargain, and it is not a reason to treat a seller badly. It does mean the asking price on a larger home is more likely to have room in it than the asking price on the terrace opposite, and that a serious, well prepared buyer carries more weight at this end of the market than at any other.
How we did this
ValuQ took HM Land Registry Price Paid Data for England and Wales, downloaded on 15 August 2026, and kept only standard full market sales. We matched every address that appears more than once, then selected homes whose previous sale fell between 1 January 2021 and 31 December 2023 and which sold again in the year to 31 May 2026. Homes bought new were excluded, because a new build sale is priced differently from a resale and would flatter the comparison. That gives 78,815 matched pairs. The regional and town tables use a two year resale window to 31 May 2026, giving 149,716 pairs, so that smaller districts carry enough sales to report.
Two honest limits. Land Registry records are still arriving for the most recent months, so sales after May 2026 are left out rather than counted early. And this measures homes that actually sold, not every owner. People who would take a loss often stay put, and people who have to move quickly are over represented in any resale sample. The comparison between one type of home and another is sound, because that bias applies to all of them equally.
ValuQ Property Watch is the platform's weekly research series, built from public data and published in full so anyone can check it. ValuQ gives UK homeowners free, side-by-side property valuations from competing local estate agents.
Sources
- [1]HM Land Registry Price Paid Data (England and Wales) · 2026-08-15 · https://www.gov.uk/government/statistical-data-sets/price-paid-data-downloads
- [2]Lloyds Banking Group House Price Index, August 2026 · 2026-09-07 · https://www.lloydsbank.com/media-centre/house-price-index.html
- [3]RICS UK Residential Market Survey, August 2026 · 2026-09-07 · https://www.rics.org/news-insights/market-surveys/uk-residential-market-survey
- [4]Mortgage Solutions: higher mortgage rates inevitable as swap rates rise, Moneyfacts · 2026-09-07 · https://www.mortgagesolutions.co.uk/mortgage-news/2026/09/07/higher-mortgage-rates-inevitable-as-swap-rates-rise-moneyfacts/
Terms in this article
Plain-English definitions from the ValuQ property glossary.
Read next
Related insights
What's the best day and time to hold house viewings?
My buyer wants a reservation agreement. Should I sign?
My deeds don't match my fence. Will that stop my sale?
Buyer demand improved again. Fewer homes are queueing behind it.
See every local agent on one screen.
Free for homeowners. Always. No cold calls. No data sales. No starting-line advantage for the fastest dialler in town.
Get your free anonymous valuationSellers and buyers never pay.