The worst house on the best street is worth a tenth of what it looks like
Published 7 September 2026 · 7 min read · By Evren Ergin
Buying the cheapest home on your street appears to beat buying the dearest by 15.2 percentage points of price growth, worth about £31,000 on a typical Essex resale. ValuQ measured it on 133,764 resales without letting one sale price do two jobs, and the gap falls to 1.6 points.
TL;DR
- •ValuQ tested "buy the worst house on the best street" on 133,764 resales of 92,443 Essex homes across 11,295 streets, using HM Land Registry Price Paid Data.
- •Measured the obvious way, buying cheaply for your street beat buying dearly for it by 15.2 points of growth, worth £31,190 on a typical resale.
- •That gap is mostly an illusion caused by one sale price being used both to judge how cheap the home was and to measure its growth. On the identical homes it falls from 11.04 points to 1.60.
- •The true effect is about 2 to 3 points, and it already includes any work owners did without subtracting what that work cost.
- •For Essex homes bought since 2015 the rule is worth nothing measurable. In Basildon the corrected gap is 0.60 points.
Advertisement

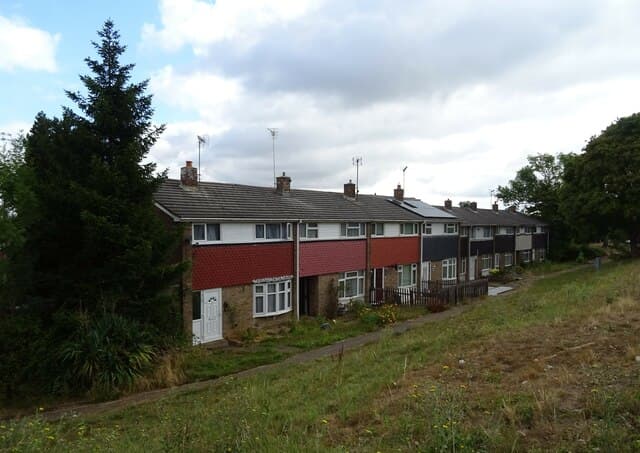
Research by ValuQ: we tested a rule almost every British homeowner has heard against 133,764 resales of 92,443 Essex homes on 11,295 streets, using HM Land Registry Price Paid Data from January 1995 to June 2026.
Buy the worst house on the best street. Almost every homeowner in Britain has heard it. Nobody, as far as we can find, has ever measured it. So we did, and the answer is that the rule is real and worth about a tenth of what it looks like. Measured the way anyone would measure it, buying cheaply for your street beat buying dearly for it by 15.2 percentage points of price growth, worth about £31,000 on a typical Essex resale. Measured properly, on the identical homes, the gap is 1.6 points.
The rule, measured the obvious way
Take every Essex resale since 1996. Work out how cheap each home was for its own street, using the price the buyer paid against what other homes of the same type on that street had been fetching. Then follow it to the next sale and see how it did against its local market.
ValuQ analysis of HM Land Registry Price Paid Data. Essex, Southend-on-Sea and Thurrock, 234,858 resales, 1996 to 2025.
| Home's price relative to its street | Resales | Growth against the local market | Median cash difference |
|---|---|---|---|
| Cheapest fifth | 46,972 | +8.63 points | +£14,390 |
| Second fifth | 46,972 | +3.22 points | +£6,400 |
| Middle fifth | 46,972 | -0.20 points | -£433 |
| Fourth fifth | 46,971 | -3.17 points | -£6,947 |
| Dearest fifth | 46,971 | -6.54 points | -£16,800 |
A clean ladder, in perfect order, across nearly a quarter of a million sales. £31,190 between the two ends. If we stopped here we would be telling you the proverb is gospel.
Why that number is wrong
A sale price is not a clean reading of what a home is worth. It carries a one-off component: the state of the garden that month, a seller who needed out, a buyer who fell for the kitchen. Our own earlier work put that one-off component at roughly 11 to 13 per cent of a sale price.
Now look again at what the table above does. It uses one single price twice. That price decides whether the home counts as cheap for its street, and it is also the starting line for measuring growth. Any home that happened to sell low looks cheap and has further to climb by the next sale. It will appear to reward the rule whether or not the rule is true.
The fix is to take the two readings from different sales. Every home below is judged cheap or dear using an earlier, separate transaction, and its growth is then tracked across the two sales that follow. Same homes. Same streets. Same growth measure. Only the source of the word cheap changes.
ValuQ analysis of HM Land Registry Price Paid Data. Identical observations, two designs.
| How the home's standing was measured | Resales | Cheapest fifth for their street | Dearest fifth | Gap |
|---|---|---|---|---|
| From the purchase price itself | 133,764 | +4.48 points | -6.57 points | 11.04 points |
| From a separate, earlier sale | 133,764 | -0.58 points | -2.19 points | 1.60 points |
The advantage falls from 11.04 points to 1.60. This is not a difference in which homes were studied. Running the flawed design on only the homes that qualify for the clean one still returns 13.03 points. The design creates the result, not the sample.
So what is it actually worth?
The clean design has its own weakness, and it pulls the other way. Reading a home's standing from an earlier sale means reading a stale one. Homes get extended, converted and neglected between sales. If staleness is the constraint, the effect should be biggest where the earlier reading is freshest, and it is.
ValuQ analysis of HM Land Registry Price Paid Data.
| Age of the reading used | Resales | Gap, cheapest fifth against dearest |
|---|---|---|
| Under 5 years old | 74,724 | 2.37 points |
| 5 to 10 years old | 39,649 | 1.40 points |
| 10 years or more | 19,391 | 0.94 points |
That behaves exactly as it should, and it agrees with a separate check on how much a home's standing drifts between sales. The honest answer is that the rule is worth about 2 to 3 points, against an apparent 15. And that figure already includes whatever work the owners did to those homes between the two sales, because the register records what a home actually sold for. It does not subtract what the work cost.
The rule has been fading, and has now stopped
Splitting by when the home was bought, and holding the length of ownership fixed at 5 to 10 years so that recent buyers are not punished for having had less time:
ValuQ analysis of HM Land Registry Price Paid Data.
| Home bought | Resales | Gap, cheapest fifth against dearest |
|---|---|---|
| 1996 to 2004 | 10,997 | +3.24 points |
| 2005 to 2014 | 27,272 | +0.45 points |
| 2015 to 2023 | 11,224 | -0.78 points |
Whatever the rule was worth to somebody buying in Essex in the late 1990s, it has not been worth anything measurable to anybody buying since 2015.
Where it counts, and where it does not
ValuQ analysis of HM Land Registry Price Paid Data. Clean design, districts with at least 2,500 resales.
| District | Resales | Gap between cheapest and dearest fifth |
|---|---|---|
| Maldon | 4,637 | 3.25 points |
| Rochford | 5,533 | 3.07 points |
| Castle Point | 5,486 | 2.40 points |
| Brentwood | 5,456 | 2.16 points |
| Braintree | 12,238 | 1.78 points |
| Tendring | 10,594 | 1.67 points |
| Epping Forest | 8,002 | 1.56 points |
| Harlow | 6,870 | 1.50 points |
| Uttlesford | 4,712 | 1.49 points |
| Southend-on-Sea | 16,576 | 1.49 points |
| Thurrock | 12,479 | 1.47 points |
| Colchester | 14,441 | 1.07 points |
| Basildon | 12,787 | 0.60 points |
| Chelmsford | 13,953 | 0.54 points |
In Basildon the flawed measurement shows a 15.9-point advantage and the corrected one shows 0.60 points. By property type, detached homes carry the widest gap at 2.71 points and flats the narrowest at 0.51, which is close enough to nothing to ignore.
What this means if you are selling
- Your street's reputation is already inside your price. The smart roads in your postcode really are dearer, by a wide margin. That gap does not get paid out a second time as growth.
- If you own the modest house on a smart road, expect ordinary numbers. Your home has been tracking its local market, a couple of points ahead at most, and less than that if you bought after 2015.
- If you own the biggest house on an ordinary road, the crude version of this pattern is unfair to you. It shows your position lagging by more than six points. Corrected, most of that disappears. A valuation leaning on the crude version will undersell you.
- Treat the proverb as an anecdote, not as evidence. It points the right way and is roughly a tenth of the size it gets quoted at. It cannot carry a pricing decision on its own.
This is research about what happened to these homes over thirty years. It is not advice on what to buy, and no single home's outcome can be read off a median.
How we did this
ValuQ analysed 1,032,113 open-market sales at 533,123 addresses in Essex, Southend-on-Sea and Thurrock from HM Land Registry Price Paid Data, covering completions from 1 January 1995 to 29 June 2026. For every street and property type we measured a street's standing from sales at other addresses on it, counting only sales that completed before the buyer in question bought, so nothing from the future enters the measure. A home's growth is its own price change between two sales, set against the change in the median for its postcode district, property type and year. The clean design covers 133,764 resales of 92,443 homes on 11,295 streets, with a median holding period of 6.1 years and a median of 31 prior street sales behind each measurement. New builds and holdings under two years are excluded, as are the discounted transfers the register flags as category B. The register carries no floor area, bedroom count or condition, and requiring three sales at one address favours homes that change hands often, which is why the gaps between groups should be read rather than the levels.
Every homeowner in Britain has been told to buy the worst house on the best street. What nobody has been able to tell them is what it was worth. The answer sitting in the public record is: something, but not much, and less every decade. That gap between what people repeat and what the data holds is the whole reason I built ValuQ. A valuation should rest on evidence about your home and your street, not on a saying.
Evren Ergin, founder of ValuQ
Common questions
Does buying the worst house on the best street still work?
Barely. On 133,764 Essex resales the advantage is about 2 to 3 points of price growth once the measurement is done properly, against an apparent 15 points in the naive version. For Essex homes bought since 2015 the advantage disappears altogether.
Why is the naive number so much bigger?
Because it uses a single sale price twice, both to judge whether the home was cheap for its street and as the starting point for measuring growth. Any home that happened to sell low on the day looks cheap and then has further to climb, so it appears to reward the rule whether the rule is true or not. Taking the two readings from different sales cuts the measured advantage from 11.04 points to 1.60 on the very same homes.
Does the street I live on matter at all, then?
Yes, a great deal, but for the level of your price rather than its growth. Streets inside one Essex postcode district differ widely, and our earlier work found that most local price variation sits below town level. What this study shows is that the difference is already priced in when you buy, and is not handed out again later as extra growth.
Does this account for people doing up the worst house?
It includes it. The register records what homes actually sold for, so any work an owner did between the two sales is already inside the 2 to 3 points. What the figure does not do is subtract what that work cost, so it is a gross number, before a single builder's invoice.
Sources
- [1]HM Land Registry Price Paid Data (complete file, England and Wales) · 2026-08-15 · https://www.gov.uk/government/statistics/about-the-price-paid-data
- [2]HM Land Registry, Price Paid Data explanatory notes (category A and category B definitions) · 2026-08-15 · https://www.gov.uk/guidance/about-the-price-paid-data
- [3]Open Government Licence v3.0 · 2014-06-01 · https://www.nationalarchives.gov.uk/doc/open-government-licence/version/3/
Terms in this article
Plain-English definitions from the ValuQ property glossary.
Read next
Related insights
In Basildon, the step up to a detached shrank by up to £23,500
A Basildon house on a Close sells 4.4% below its neighbours
Does a good school nearby add value to my house?
Should I price my house on what I need for my next one?
What is your home worth today?
ValuQ gives UK homeowners free, side-by-side property valuations from competing local estate agents. Anonymous until you choose. No cold calls.
Get your free anonymous valuationSellers and buyers never pay.