Essex homes are being valued on the thinnest sales evidence in 30 years
Published 1 September 2026 · 9 min read · By Evren Ergin
Fewer than one Essex home in ten sold in 2025 had three recent sales of its own property type in its own postcode to be valued against. In 2007 it was nearly one in four.
TL;DR
- •ValuQ counted the comparable sales available to every one of 995,187 Essex home sales from 1996 to 2025, using HM Land Registry Price Paid Data.
- •In 2025, 9.6% of homes sold had three or more same-type sales in their own postcode in the previous year, down from 23.3% in 2007.
- •76.6% now depend on evidence from the wider postcode sector, where two comparable homes sold within a year are typically £75,000 apart, against £45,000 in the same postcode.
- •Essex prices rose 89.7% between 2007 and 2025 while sales fell from 43,604 to 26,588, so the evidence base halved and never recovered.
- •In Basildon, the share able to find three comparables in their own postcode fell from 17.9% to 8.5%.
Advertisement

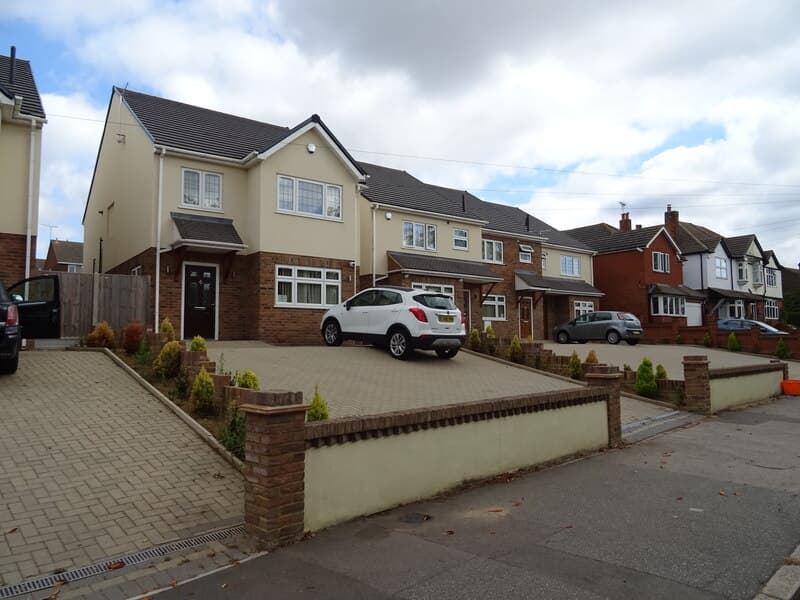
Research by ValuQ: we took 1,029,806 HM Land Registry sales across Essex, Southend-on-Sea and Thurrock from 1995 to 2026 and counted, for every single sale, how many sales of the same property type had happened in its own postcode, on its own street and in its wider postcode sector in the twelve months before it.
In 2025, fewer than one Essex home in ten that changed hands had three recent sales of its own property type in its own postcode to be valued against. The exact figure is 9.6 per cent. In 2007 it was 23.3 per cent.
Valuations are built from comparable evidence, meaning recent sales of similar homes nearby. For most homes in Essex, that evidence no longer exists at the scale of the postcode, and for a growing share it does not exist on the street either.
The evidence did not disappear, it moved further away
Three quarters of Essex homes sold in 2025 had to reach past their own street to the wider postcode sector before three same-type comparables could be found. In 2007 that share was 57.3 per cent. A postcode sector holds a median of about 2,200 addresses that have sold at least once since 1995, so this is a large step outward.
The average home sold in the area in 2025 had 1.84 same-type sales on its own street in the previous year. Across the twelve years to 2007 the figure was 4.04. Both the street and the postcode readings for 2025 are the lowest in the thirty-year record, below even 2009.
ValuQ analysis: how far an Essex home valuation has to reach to find three recent sales of the same property type. Essex, Southend-on-Sea and Thurrock. Source: HM Land Registry Price Paid Data.
| Tightest ring holding three same-type comparables | 2007 | 2024 | 2025 |
|---|---|---|---|
| Own postcode | 23.3% | 10.6% | 9.6% |
| Own street | 19.3% | 11.2% | 13.1% |
| Wider postcode sector | 57.3% | 77.4% | 76.6% |
| Not even the sector | 0.2% | 0.7% | 0.6% |
Why this happened, and why prices did not fix it
Prices recovered from the financial crisis. Sales volumes did not. The median sale price in the area went from £195,000 in 2007 to £370,000 in 2025, a rise of 89.7 per cent. Over the same period the number of sales fell from 43,604 to 26,588.
Comparable evidence is written by sales, not by prices. Fewer sales means a thinner record, and the record has stayed thin for seventeen years. In 2025, 38.4 per cent of homes sold had no same-type sale at all on their own street in the previous twelve months, against 24.3 per cent in 2007.
This is not a case of postcodes being carved up as new estates were built, which would spread the same sales across more units. The number of Essex postcodes recording at least one sale actually fell, from 19,410 in 2007 to 16,112 in 2025.
What the extra distance costs
Reaching further for evidence has a price, and it can be measured. We compared pairs of second-hand houses of the same property type sold within a year of each other in 2024 and 2025.
ValuQ analysis: how far apart two comparable Essex homes actually sell. Detached, semi-detached and terraced homes, second-hand only, sold within 365 days of each other, 2024 to 2025. Source: HM Land Registry Price Paid Data.
| Relationship between the two homes | Pairs analysed | Typical price gap | Gap as a share of the lower price |
|---|---|---|---|
| Same postcode | 18,290 | £45,000 | 12.7% |
| Same street, different postcode | 19,349 | £60,000 | 16.5% |
| Same postcode sector, different street | 1,370,662 | £75,000 | 21.4% |
Two homes of the same type in the same postcode, sold within a year of each other, are typically £45,000 apart. Move out to the sector and the typical gap is £75,000. The sector is not a bad place to look for evidence. It is simply a wider one, and width costs precision.
The ladder itself has not changed. Measured in 2006 and 2007 the same three rings produced median gaps of 10.2, 15.4 and 21.3 per cent, against 11.3, 17.4 and 20.5 per cent in 2024 and 2025. Comparables have not become less useful. Homes have been pushed further along the ladder to reach them.
Where in Essex the evidence is thinnest
ValuQ analysis: share of homes sold with three or more same-type sales in their own postcode in the previous twelve months. Source: HM Land Registry Price Paid Data.
| District | Could find three in own postcode, 2007 | Could find three in own postcode, 2025 | Sales, 2025 |
|---|---|---|---|
| Castle Point | 13.1% | 4.7% | 1,299 |
| Southend-on-Sea | 24.2% | 7.4% | 2,377 |
| Thurrock | 34.7% | 8.1% | 2,004 |
| Basildon | 17.9% | 8.5% | 2,491 |
| Epping Forest | 20.8% | 8.6% | 1,822 |
| Colchester | 28.0% | 9.0% | 2,756 |
| Maldon | 21.8% | 9.2% | 1,061 |
| Harlow | 26.3% | 10.0% | 1,055 |
| Chelmsford | 26.1% | 10.3% | 2,601 |
| Brentwood | 20.7% | 11.0% | 1,279 |
| Rochford | 23.0% | 11.0% | 1,385 |
| Braintree | 20.3% | 11.3% | 2,373 |
| Tendring | 18.4% | 12.2% | 2,598 |
| Uttlesford | 21.1% | 13.4% | 1,487 |
Every district fell. Thurrock fell furthest, from 34.7 per cent to 8.1 per cent. Castle Point ends lowest at 4.7 per cent.
Basildon
In Basildon, the average home sold in 2025 had 1.55 same-type sales on its own street in the previous year, down from 2.65 in 2007. The share of Basildon homes with no same-type sale at all on their street rose from 26.7 per cent to 37.7 per cent, and the share able to find three in their own postcode fell from 17.9 per cent to 8.5 per cent.
The thinning falls hardest on the ordinary family house. Among all Essex sales in 2025, the share able to find three same-type comparables in their own postcode was 5.9 per cent for semi-detached homes, 7.1 per cent for terraced homes and 9.4 per cent for detached homes. Flats managed 20.6 per cent, because blocks cluster many similar units into a single postcode.
What this means if you are selling
The most likely position for an Essex homeowner is this one. There has been no sale of a home like yours in your postcode in the past year, and possibly none on your street. The valuations you are given are built from sales further away than most people assume.
- A single valuation is one reading, not the answer. In the ring most valuations now have to use, two genuinely similar homes sold within a year of each other are typically 21.4 per cent apart. That spread sits inside the evidence itself, before anyone forms a view about your kitchen or your garden.
- Ask which sales the number came from. Which properties, how recent, how far away, and what was adjusted for the differences. A well prepared valuer will have the answer ready, and if the comparables are half a mile away and eighteen months old, that is worth knowing before you set an asking price on them.
- Compare more than one. When the underlying evidence is thin, the variation between valuations is telling you something real about the uncertainty around your own home.
Earlier ValuQ research found that two homes in the same Essex town differ more in price growth than the county's best and worst towns do. That is why the street matters so much. This study is the other half of that picture: the street is what matters most, and the street is where the evidence has thinned the furthest.
A valuer in Basildon today is working from around half the local sales their predecessor had in 2007, and the sales they do have are further away. That is not a criticism of anyone doing the job. It is a description of the ground they are standing on.
Evren Ergin, founder of ValuQ, said: "I built ValuQ because the gap between one valuation and the next was never properly explained to the person selling. This research shows part of the reason. The market that produces the evidence has got much thinner, and nobody told homeowners. What follows is simple enough. Treat one number as one opinion, ask what it was built from, and look at more than one before you decide."
How we did this
ValuQ analysed 1,029,806 HM Land Registry Price Paid records for Essex, Southend-on-Sea and Thurrock, covering sales completed between 1 January 1995 and 28 May 2026, across 523,145 distinct addresses, 39,075 postcodes, 22,805 streets and 254 postcode sectors. We kept only Price Paid category A sales, which is HM Land Registry's flag for transfers at full market value, and the four residential property types.
For each of the 995,187 sales completed from 1996 to 2025, we counted other sales of the same property type, at a different address, in the 365 days before it, within three nested rings: the same full postcode, the same street, and the same postcode sector. For the price gap tables we compared pairs of same-type sales in the same sector completed within 365 days of each other.
2026 is excluded because Price Paid Data registers sales with a delay and the 2026 months in this file are incomplete. 2024 is reported alongside 2025 throughout so that no conclusion rests on the most recent year alone. Removing new-build sales entirely strengthens the finding rather than weakening it: on that basis the share of Essex homes able to find three comparables in their own postcode fell from 19.3 per cent in 2007 to 6.9 per cent in 2025. Allowing a two year lookback instead of one year, the 2025 figure is 20.5 per cent against 40.4 per cent in 2007.
Price Paid Data records completed sales only, so homes marketed and withdrawn leave no trace, and property type is the sole physical characteristic recorded, so same-type comparability is a coarse standard. The three rings are administrative units rather than true distance.
What is a comparable in a house valuation?
A comparable is a recent sale of a similar property nearby, used as evidence of what your home is worth. Valuers and estate agents build a valuation from a small set of them, adjusting for differences in size, condition and position.
How many comparables should a valuation use?
Industry practice is a handful of recent, similar, nearby sales. This research found that in 2025 only 9.6 per cent of Essex homes had three or more sales of the same property type in their own postcode in the previous year, so most valuations have to draw on evidence from further away.
Why do estate agents give different valuations for the same house?
Part of the answer is the evidence itself. Two genuinely similar homes in the same postcode sector, sold within a year of each other, differ by a median of £75,000 in Essex. When valuers draw on different sales from that range, they reach different numbers before any judgement about the home is applied.
How can I check a valuation on my own home?
Ask the valuer which sales they used, how recent they are and how far away. Then compare more than one valuation. The spread between them reflects real uncertainty, and seeing the range is more useful than seeing a single point inside it.
Sources
- [1]HM Land Registry Price Paid Data (complete file, England and Wales) · 2026-07-16 · https://www.gov.uk/government/statistics/about-the-price-paid-data
- [2]HM Land Registry, Price Paid Data explanatory notes (category A definition) · 2026-07-16 · https://www.gov.uk/guidance/about-the-price-paid-data
- [3]RICS professional standard, Comparable Evidence in Real Estate Valuation · 2019-10-01 · https://www.rics.org/profession-standards/rics-standards-and-guidance/sector-standards/valuation-standards/comparable-evidence
Terms in this article
Plain-English definitions from the ValuQ property glossary.
Read next
Related insights
In Basildon, the step up to a detached shrank by up to £23,500
A Basildon house on a Close sells 4.4% below its neighbours
Trading up to a detached got cheaper in the South East. Not the North.
Online estate agent or high street agent: which should I use?
Is your asking price where it should be?
ValuQ gives UK homeowners free, side-by-side property valuations from competing local estate agents. Anonymous until you choose. No cold calls.
Get your free anonymous valuationSellers and buyers never pay.