Basildon homes gained £8,500 last year. Dagenham gained £20,000.
Published 19 July 2026 · 7 min read · By Evren Ergin
The typical second-hand family home in Basildon sold for £375,000 last year, up £8,500 on 2024. Along the same c2c line, homes in Dagenham gained £20,000 and homes in Grays and Tilbury rose almost twice as fast as Basildon's did.
TL;DR
- •Basildon's median second-hand house price rose 2.3% between 2024 and 2025, from £366,500 to £375,000.
- •That is below the England and Wales average of 3.2%, and ranks Basildon 168th of the 312 local authorities ValuQ analysed.
- •Every neighbouring borough except Brentwood grew faster, led by Chelmsford at 4.8% and Havering at 4.4%.
- •On the c2c line, the stops closest to London rose fastest. Dagenham gained 5.5% and Tilbury 4.4%, against 1.6% in Pitsea.
Advertisement

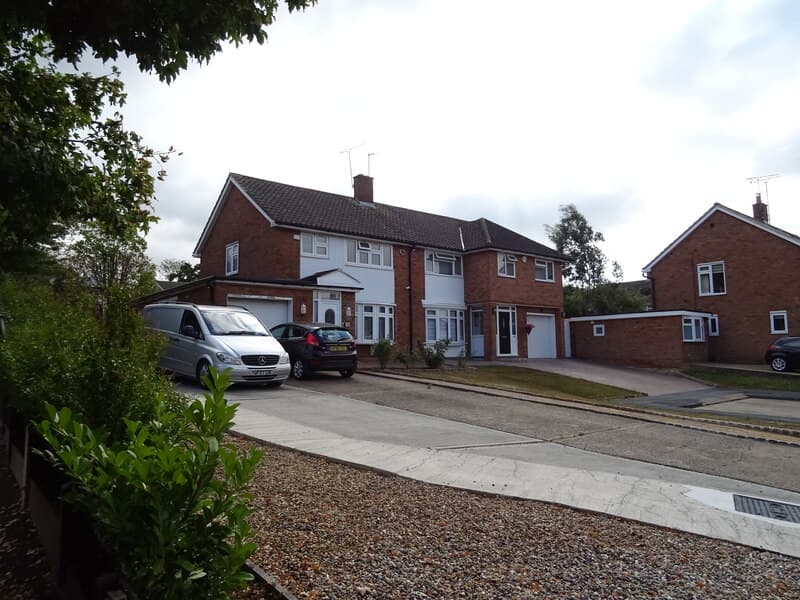
Research by ValuQ: we analysed every second-hand house sale registered with HM Land Registry in Basildon and along the c2c line during 2024 and 2025, and compared the median sale price in each postcode district and borough.
What happened to Basildon house prices last year?
Basildon had a steady year rather than a strong one. The median second-hand house sold for £375,000 in 2025 against £366,500 in 2024, a gain of £8,500 or 2.3%. Across England and Wales the same measure rose 3.2%.
That gap sounds small. On a £375,000 home it is the difference between gaining £8,500 and gaining £11,700 in a single year, and it has now been running in the same direction for two years.
How does Basildon compare with its neighbours?
Basildon grew more slowly than every neighbouring authority except Brentwood, where the median was unchanged. The strongest growth in the area came from Chelmsford and from the London boroughs at the western end of the line.
Median second-hand house price by borough, 2025 against 2024. ValuQ analysis of HM Land Registry Price Paid Data.
| Borough | 2024 median | 2025 median | Change | Change % | Sales in 2025 |
|---|---|---|---|---|---|
| Chelmsford | £422,750 | £443,000 | +£20,250 | +4.8% | 2,159 |
| Havering | £455,000 | £475,000 | +£20,000 | +4.4% | 2,824 |
| Barking and Dagenham | £384,000 | £400,000 | +£16,000 | +4.2% | 1,282 |
| Southend-on-Sea | £375,000 | £387,500 | +£12,500 | +3.3% | 1,884 |
| Thurrock | £365,000 | £375,000 | +£10,000 | +2.7% | 1,754 |
| Castle Point | £365,000 | £375,000 | +£10,000 | +2.7% | 1,252 |
| Basildon | £366,500 | £375,000 | +£8,500 | +2.3% | 2,317 |
| Brentwood | £555,000 | £555,000 | £0 | 0.0% | 1,017 |
Why does the train line matter?
Basildon's housing market has been shaped for decades by one idea: buy further out along the c2c line and your money buys more house. For most of the past five years the towns at the Essex end of that line were the ones pulling ahead, as buyers left London for space.
The sold-price data for 2025 shows that pattern running the other way. The fastest growth on the line is now at the London end and in Thurrock, and the slowest is in Basildon's own postcodes and out toward Southend.
Median second-hand house price by postcode district along the c2c line, 2025 against 2024, ordered from London outwards. ValuQ analysis of HM Land Registry Price Paid Data.
| Postcode district | Area | 2024 median | 2025 median | Change % | Sales in 2025 |
|---|---|---|---|---|---|
| IG11 | Barking | £440,000 | £450,000 | +2.3% | 235 |
| RM9 | Dagenham | £365,000 | £385,000 | +5.5% | 279 |
| RM13 | Rainham | £420,000 | £430,000 | +2.4% | 369 |
| RM17 | Grays | £336,000 | £350,000 | +4.2% | 278 |
| RM18 | Tilbury | £328,000 | £342,500 | +4.4% | 181 |
| SS17 | Stanford-le-Hope | £370,000 | £370,000 | 0.0% | 411 |
| SS13 | Pitsea | £310,000 | £315,000 | +1.6% | 223 |
| SS14 | Basildon town centre | £314,500 | £325,000 | +3.3% | 328 |
| SS15 | Laindon | £346,250 | £357,000 | +3.1% | 369 |
| SS16 | Langdon Hills | £350,000 | £360,000 | +2.9% | 341 |
| SS7 | Benfleet | £400,000 | £410,000 | +2.5% | 725 |
| SS9 | Leigh-on-Sea | £450,000 | £450,000 | 0.0% | 663 |
| SS0 | Westcliff-on-Sea | £361,100 | £385,000 | +6.6% | 370 |
| SS3 | Shoeburyness | £352,500 | £350,000 | -0.7% | 297 |
Two entries deserve a caution. Westcliff-on-Sea and Shoeburyness rest on smaller numbers of sales than the Basildon postcodes, so a change in the mix of homes sold moves their median more than it moves a larger area's. The Basildon postcodes each carry between 223 and 369 sales, which is enough to read as a trend rather than noise.
What does this mean for my home in Basildon?
It means the market under your house is steady, and it is no longer outrunning the places closer to London. If you bought in Basildon expecting the out-of-London premium to keep lifting your home faster than average, last year did not do that.
- Basildon prices are rising, not falling. The typical second-hand family home gained £8,500 over the year.
- The gain is below the national rate, so a valuation based on national headlines may be ahead of the local evidence.
- The four Basildon postcodes moved differently from each other, from 1.6% in Pitsea to 3.3% around the town centre. Your postcode matters more than the town figure.
- A median is the middle sale, so half of Basildon homes sold above £375,000 and half below.
Where can I see the sold prices near me?
ValuQ publishes the underlying Basildon sold-price data as free tools. The Basildon postcode map plots HM Land Registry sold prices on an Ordnance Survey base map, with school, station and postcode layers, so you can see what has actually changed hands on the roads around you rather than across the whole town.
The Basildon property market pages break the same data down by SS postcode and by property type, so a detached home in SS16 is compared with detached homes rather than with the town average. Both are free and neither asks for your details.
What should Basildon sellers do now?
- Start from the sold prices on your own street and in your own postcode, not the Basildon average.
- Get more than one valuation. In a market growing at 2.3% a year, the spread between three agents' opinions is often wider than a whole year of price growth.
- Ask each agent which comparable sales they used and when those sales completed. A comparable from early 2024 belongs to a different market.
- Be careful with the highest number. An agent who values above the evidence wins the instruction and then asks for a reduction six weeks later, and a home that has sat unsold carries that history with it.
- If you are moving toward London rather than away from it, the gap you are trying to bridge got wider last year, not narrower.
What about buyers?
- Basildon is now cheaper relative to Grays, Tilbury and Dagenham than it was a year ago, which is a change worth knowing if you are choosing between stops.
- Pitsea at a £315,000 median remains the lowest entry point of the Basildon postcodes.
- Leigh-on-Sea and Stanford-le-Hope were flat across the year, so sellers there have less recent growth to point at in a negotiation.
How we did this
ValuQ analysed HM Land Registry Price Paid Data for every residential sale registered in England and Wales during 2024 and 2025, downloaded on 18 July 2026. We kept detached, semi-detached and terraced houses and excluded flats, new-build homes, sales under £20,000 or above £5,000,000, and deleted records. New builds were excluded because they register with HM Land Registry much later than second-hand homes, which would otherwise make recent months look artificially cheap.
We then took the median sale price for each borough and each postcode district in both years. Basildon's figures rest on 2,008 qualifying sales in 2024 and 2,317 in 2025. The national comparison covers the 312 local authorities with at least 400 qualifying sales in both years, in which Basildon ranks 168th for price growth.
Basildon has not gone backwards. It has been overtaken, and quietly, by the places people used to leave. If you are selling here, the number that matters is the one on your street this year, not the one the town was worth two years ago.
That is Evren Ergin, founder of ValuQ. This is ValuQ Property Watch, our weekly research series on what the sold-price data shows. ValuQ gives UK homeowners free, side-by-side property valuations from competing local estate agents.
Are house prices going up or down in Basildon?
Up, slowly. The median second-hand house in Basildon sold for £375,000 in 2025 against £366,500 in 2024, a rise of 2.3%. That is below the England and Wales figure of 3.2% for the same measure.
What is the average house price in Basildon?
On ValuQ's analysis of HM Land Registry sales, the median second-hand house price in Basildon was £375,000 in 2025. Median means the middle sale, so half of homes sold for more and half for less. Flats and new builds are excluded from that figure.
Which Basildon postcode has grown fastest?
SS14, covering the town centre, grew fastest of the four Basildon postcode districts at 3.3%, from £314,500 to £325,000. SS13 around Pitsea grew slowest at 1.6%.
How do I find out what my Basildon home is worth today?
Sold prices show what homes near you have already achieved, which is where a valuation starts rather than where it ends. For a current figure, compare valuations from more than one local agent who has seen your home's condition, layout and position.
Sources
- [1]HM Land Registry Price Paid Data (2024 and 2025 files, accessed 18 July 2026) · 2026-07-18 · https://www.gov.uk/government/statistical-data-sets/price-paid-data-downloads
- [2]ONS and HM Land Registry UK House Price Index, April 2026 · 2026-06-17 · https://www.gov.uk/government/statistics/uk-house-price-index-for-april-2026/uk-house-price-index-summary-april-2026
- [3]Rightmove House Price Index, June 2026 · 2026-06-15 · https://www.rightmove.co.uk/news/house-price-index/
Terms in this article
Plain-English definitions from the ValuQ property glossary.
Read next
Related insights
In Basildon, the step up to a detached shrank by up to £23,500
A Basildon house on a Close sells 4.4% below its neighbours
Rightmove October 2026: prices up 1%, but 1 in 3 homes cut
Which homes are selling fastest right now, and is mine one?
Is your asking price where it should be?
ValuQ gives UK homeowners free, side-by-side property valuations from competing local estate agents. Anonymous until you choose. No cold calls.
Get your free anonymous valuationSellers and buyers never pay.