House prices now falling in more than 1 in 4 areas of Britain
Published 16 September 2026 · 6 min read · By Evren Ergin
On 16 September 2026 the official UK House Price Index showed average prices up 1.4% in the year to July, but ValuQ analysis of the same data found prices falling in 97 of 349 local areas in Great Britain, up from 72 a month earlier. The national figure is holding up while the number of places going backwards has jumped.
TL;DR
- •The average UK home was worth £273,000 in July 2026, up 1.4% on a year earlier, the third month of slowing growth.
- •ValuQ analysis: prices were lower than a year ago in 97 of 349 local areas in England, Scotland and Wales, up from 72 in June.
- •London fell 3.3% over the year and flats fell 2.4% nationally, while semi-detached homes rose 2.9%.
- •Basildon edged up 0.6% while nearby Castle Point fell 4.3%, so a seller's local figure matters far more than the national one.
Advertisement

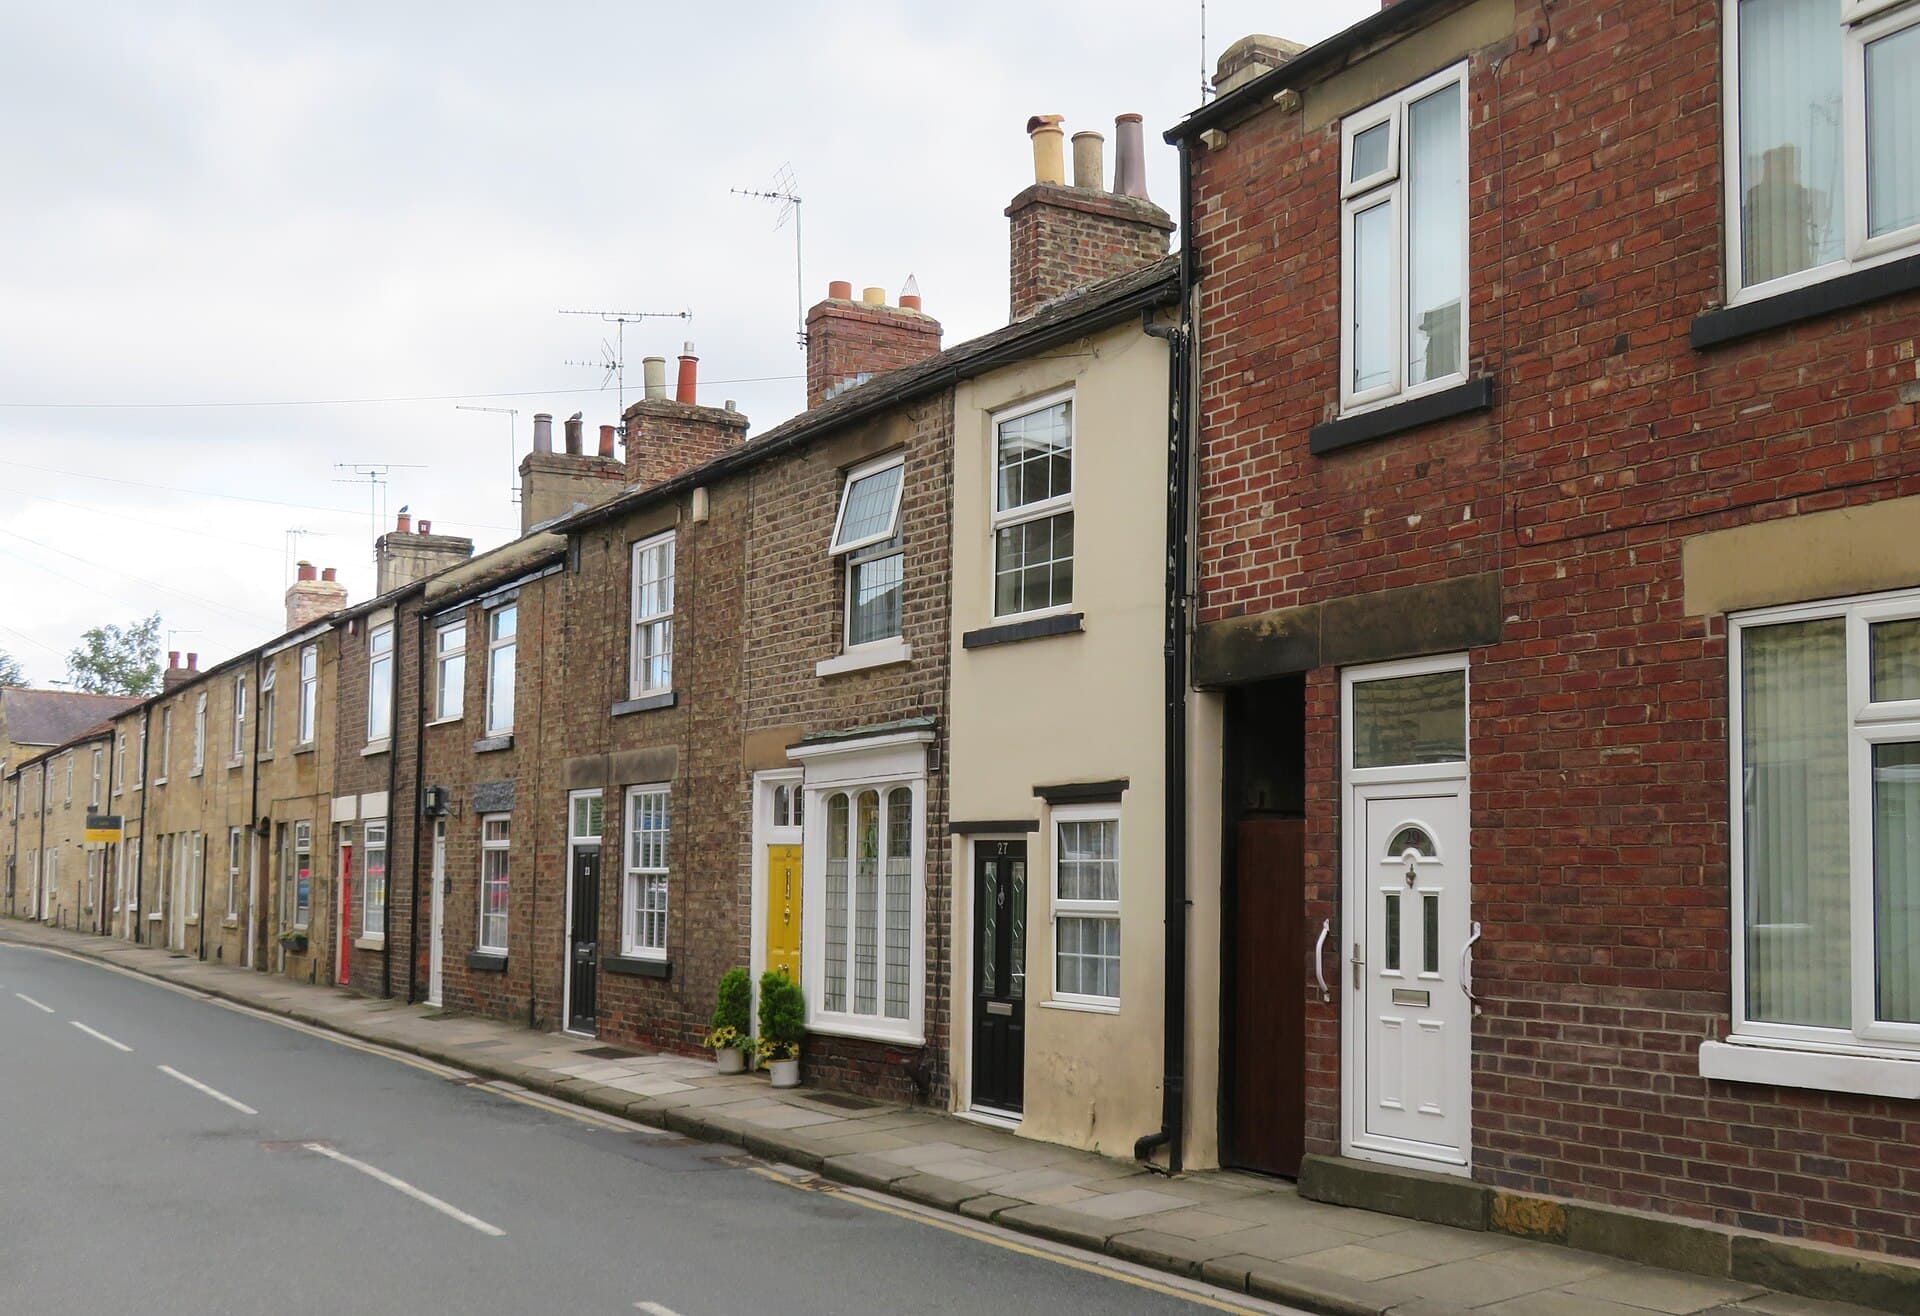
Research by ValuQ: we counted, month by month, how many of the 349 local authority areas in England, Scotland and Wales showed a fall in average prices over 12 months, using the HM Land Registry UK House Price Index file published on 16 September 2026.
ValuQ Property Watch. On 16 September 2026 the official UK House Price Index put the average UK home at £273,000 in July, up 1.4% on a year earlier. The national number hides a sharper local picture: prices were lower than a year ago in 97 local areas, up from 72 a month earlier.
What did the official figures show for July 2026?
The UK House Price Index is the government's official measure of house prices, built from completed sales registered with HM Land Registry and published with the Office for National Statistics. Because it counts completed sales, July's figures reflect deals mostly agreed in the spring.
- The average UK price was £273,000, about £4,000 higher than in July 2025.
- Annual growth slowed to 1.4%, from a revised 1.5% in June. It was the third month of slowing in a row.
- June was first published at 2.0% and has now been revised down to 1.5%, a reminder that early figures move.
- Prices rose 0.7% between June and July before seasonal adjustment, but fell 0.2% once the usual summer lift is stripped out.
- Flats fell 2.4% over the year, the one property type to go down, while semi-detached homes rose 2.9%.
Where are house prices falling?
ValuQ analysis. We took every local authority area in England, Scotland and Wales and counted those where the average price was lower than 12 months earlier. Northern Ireland is left out because its figures are published quarterly rather than monthly.
ValuQ analysis: local areas with a 12-month price fall, June vs July 2026 (HM Land Registry UK HPI, published 16 September 2026)
| Area group | Local areas | Falling in June | Falling in July |
|---|---|---|---|
| England outside London | 262 | 44 | 64 |
| London boroughs | 33 | 19 | 21 |
| Scotland | 32 | 5 | 7 |
| Wales | 22 | 4 | 5 |
| Great Britain total | 349 | 72 (20.6%) | 97 (27.8%) |
The jump came almost entirely from outside London. In one month, 42 areas moved from rising prices to falling prices, while 17 moved the other way. London is still the weakest region, down 3.3% over the year and falling for an eleventh month in a row.
Is this a new low for the market?
No, and that matters. The count has swung this year rather than marched in one direction. It peaked in March 2026, when 119 areas were falling, eased to 72 in May and June, and has now returned to April's level.
ValuQ analysis: Great Britain local areas with a 12-month price fall, by month (349 areas)
| Month | Areas falling | Share of areas |
|---|---|---|
| September 2025 | 98 | 28.1% |
| December 2025 | 98 | 28.1% |
| March 2026 | 119 | 34.1% |
| April 2026 | 97 | 27.8% |
| May 2026 | 72 | 20.6% |
| June 2026 | 72 | 20.6% |
| July 2026 | 97 | 27.8% |
Read it as a market that is flat to soft and patchy, not one in freefall. Almost three quarters of areas are not below last year's level.
Which areas turned from rising to falling?
Some of the biggest swings were in commuter and coastal areas that had been rising comfortably in June.
Areas where annual price change turned negative in July 2026 (HM Land Registry UK HPI)
| Area | Average price, July | Annual change, June | Annual change, July |
|---|---|---|---|
| Epping Forest | £525,719 | +4.3% | -1.6% |
| Dartford | £347,773 | +3.1% | -2.0% |
| Norwich | £224,323 | +3.0% | -2.3% |
| Redbridge | £481,297 | +2.5% | -2.7% |
| Thurrock | £321,941 | +1.8% | -0.9% |
| North Norfolk | £292,563 | +1.4% | -3.1% |
Local figures are built from fewer sales than the national one, so a single month can swing on a handful of expensive or cheap homes. Treat one month as a signal to check, not a verdict.
What happened in Basildon and south Essex?
South Essex shows how far apart neighbouring towns can sit. Basildon moved the other way to the national trend, from a small fall in June to a small rise in July, while Castle Point and Brentwood slipped further.
South Essex areas, July 2026 (HM Land Registry UK HPI)
| Area | Average price, July | Annual change, June | Annual change, July |
|---|---|---|---|
| Basildon | £367,233 | -0.4% | +0.6% |
| Southend-on-Sea | £328,383 | +3.5% | +1.6% |
| Thurrock | £321,941 | +1.8% | -0.9% |
| Chelmsford | £378,080 | -1.9% | -2.3% |
| Brentwood | £514,480 | -1.7% | -2.4% |
| Castle Point | £356,579 | -0.9% | -4.3% |
For Basildon's own breakdown by postcode and property type, ValuQ's Basildon property market page splits HM Land Registry sales across SS13 to SS16.
What does this mean if I am selling?
It means the national headline is the wrong number to price from. Two homeowners a few miles apart can be living in a rising market and a falling one in the same month.
- Price from your own street and property type, not from the UK average or a newspaper headline.
- If you own a flat, expect buyers to know flats fell 2.4% nationally, and price with that in mind.
- Remember these are spring deals. Two-year fixed mortgages averaged 5.73% on 15 September, according to Moneyfacts, up from 4.84% on 1 March, so buyers today are borrowing on tighter terms than the buyers in these figures.
- Ask more than one local agent for a figure, because in a patchy market their views will differ more than usual.
When a quarter of the country is falling and three quarters is rising, the average that matters most is the one on your street.
What does it mean if I am buying?
Buyers in the areas that have turned negative have more room to negotiate than they did in spring, particularly on flats. The trade-off is borrowing cost: consumer price inflation rose to 3.1% in August, published the same morning, and the Bank of England announces its next Bank Rate decision on 17 September 2026.
Did house prices beat inflation?
No. Prices rose 1.4% in the year to July while consumer prices rose 2.9% over the same period, so the average home lost value in real terms, as it did in June.
How we did this
How we did this: ValuQ downloaded the HM Land Registry UK House Price Index average-price file for July 2026, published on 16 September 2026, and kept the 349 local authority areas in England, Scotland and Wales and counted, for each month, those with a negative 12-month change. June figures are the revised ones in this release. The latest months are provisional and will be revised as more sales are registered.
ValuQ gives UK homeowners free, side-by-side property valuations from competing local estate agents, so you can see what your own home is worth in your own patch before you decide anything.
Sources
- [1]HM Land Registry and ONS, UK House Price Index summary: July 2026 · 2026-09-16 · https://www.gov.uk/government/statistics/uk-house-price-index-for-july-2026/uk-house-price-index-summary-july-2026
- [2]HM Land Registry, UK HPI average prices data download, July 2026 (Average-prices-2026-07.csv) · 2026-09-16 · https://www.gov.uk/government/statistical-data-sets/uk-house-price-index-data-downloads-july-2026
- [3]Office for National Statistics, Consumer price inflation, UK: August 2026 · 2026-09-16 · https://www.ons.gov.uk/economy/inflationandpriceindices/bulletins/consumerpriceinflation/august2026
- [4]Property Industry Eye, Mortgage rates surge again as major lenders reprice (Moneyfacts data) · 2026-09-16 · https://propertyindustryeye.com/mortgage-rates-surge-again-as-major-lenders-reprice/
- [5]HM Land Registry and ONS, UK House Price Index summary: June 2026 · 2026-08-19 · https://www.gov.uk/government/statistics/uk-house-price-index-for-june-2026/uk-house-price-index-summary-june-2026
Terms in this article
Plain-English definitions from the ValuQ property glossary.
Read next
Related insights
My buyer wants to wait until after the Budget. What should I do?
My buyer pulled out. Can I get my costs back?
My buyer pulled out after the survey. Can I see the report?
My cash buyer is messaging me directly. Should I reply?
See every local agent on one screen.
Free for homeowners. Always. No cold calls. No data sales. No starting-line advantage for the fastest dialler in town.
Get your free anonymous valuationSellers and buyers never pay.